Italian regional elections, 1970
Italian regional elections, 1970

|
|
|
|
|

|
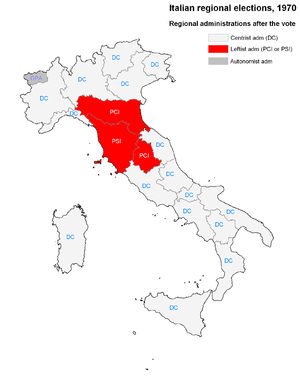
| Regional election results map. White denotes regions with a centrist (Christian Democratic) administration, Red denotes those with a leftist (Communist-Socialist) administration, Gray denotes those with an Autonomist administration. |
|
The Italian regional elections of 1970 were held on June 7 . Even if the regional system was conceived by the Italian Constitution in 1948, the five autonomous regions were the sole to be immediately established. The fifteen ordinary regions were indeed created in 1970 with the first elections.
Electoral system
The pure party-list proportional representation had traditionally become the electoral system of Italy, and it was adopted for the regional vote too. Each Italian province corresponded to a constituency electing a group of candidates. At constituency level, seats were divided between open lists using the largest remainder method with Droop quota. Remaining votes and seats were transferred at regional level, where they was divided using the Hare quota, and automatically distributed to best losers into the local lists.
Results
Summary of the results of all the lists reaching at least a tenth of the suffrages.
| Piedmont |
|
Christian Democracy |
1,029,883 |
36.7% |
20 |
|
Italian Communist Party |
727,619 |
25.9% |
13 |
|
Italian Socialist Party |
296,219 |
10.6% |
5 |
| Lombardy |
|
Christian Democracy |
2,138,141 |
40.9% |
36 |
|
Italian Communist Party |
1,210,068 |
23.1% |
19 |
|
Italian Socialist Party |
648,696 |
12.4% |
9 |
| Veneto |
|
Christian Democracy |
1,287,167 |
51.9% |
28 |
|
Italian Communist Party |
417,204 |
16.8% |
9 |
|
Italian Socialist Party |
259,174 |
10.5% |
5 |
| Ligury |
|
Christian Democracy |
393,478 |
32.1% |
14 |
|
Italian Communist Party |
383,296 |
31.3% |
13 |
|
Italian Socialist Party |
138,439 |
11.3% |
4 |
| Emilia-Romagna |
|
Italian Communist Party |
1,148,643 |
44.0% |
24 |
|
Christian Democracy |
672,755 |
25.8% |
14 |
| Tuscany |
|
Italian Communist Party |
985,382 |
42.3% |
23 |
|
Christian Democracy |
710,908 |
30.5% |
17 |
| Umbria |
|
Italian Communist Party |
215,174 |
41.8% |
13 |
|
Christian Democracy |
154,878 |
30.1% |
9 |
| Marche |
|
Christian Democracy |
333,383 |
38.6% |
17 |
|
Italian Communist Party |
274,915 |
31.8% |
14 |
| Lazio |
|
Christian Democracy |
890,749 |
33.2% |
18 |
|
Italian Communist Party |
710,273 |
26.5% |
13 |
|
Italian Social Movement |
274,244 |
10.2% |
5 |
| Abruzzo |
|
Christian Democracy |
325,644 |
48.3% |
20 |
|
Italian Communist Party |
153,854 |
22.8% |
10 |
| Molise |
|
Christian Democracy |
92,839 |
52.1% |
16 |
|
Italian Communist Party |
26,714 |
15.0% |
5 |
| Campania |
|
Christian Democracy |
1,001,340 |
39.6% |
25 |
|
Italian Communist Party |
551,599 |
21.8% |
13 |
|
Italian Socialist Party |
276,225 |
10.9% |
7 |
| Apulia |
|
Christian Democracy |
766,254 |
41.3% |
22 |
|
Italian Communist Party |
488,709 |
26.3% |
14 |
|
Italian Socialist Party |
197,519 |
10.6% |
5 |
| Basilicata |
|
Christian Democracy |
131,602 |
42.4% |
14 |
|
Italian Communist Party |
74,688 |
24.0% |
7 |
|
Italian Socialist Party |
39,464 |
12.7% |
4 |
| Calabria |
|
Christian Democracy |
374,215 |
39.7% |
17 |
|
Italian Communist Party |
218,845 |
23.2% |
10 |
|
Italian Socialist Party |
132,898 |
14.1% |
6 |
Twelve Regional Councils elected an administration led by Christian Democracy in a centrist alliance, while Emilia-Romagna, Umbria and Tuscany chose a leftist administration, the first two regions led by the PCI and the other one by the PSI.

