Canarian parliamentary election, 1999
Canarian parliamentary election, 1999
|
|
|
|
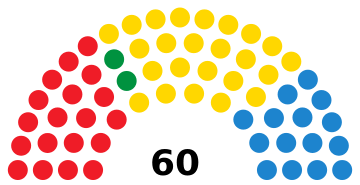
All 60 seats in the Parliament of Canarias
31 seats needed for a majority |
| Registered |
1,331,110  6.6% 6.6% |
| Turnout |
835,181 (62.7%)
 1.5 pp 1.5 pp |
| |
First party |
Second party |
Third party |
| |
.jpg) |
 |
|
| Leader |
Román Rodríguez |
José Miguel Bravo de Laguna |
Jerónimo Saavedra |
| Party |
CC |
PP |
PSOE |
| Leader since |
1999 |
1991 |
1999 |
| Last election |
21 seats, 32.8% |
18 seats, 31.1% |
16 seats, 23.1% |
| Seats won |
24 |
15 |
19 |
| Seat change |
3 |
3 |
3 |
| Popular vote |
306,658 |
225,316 |
199,503 |
| Percentage |
36.9% |
27.1% |
24.0% |
| Swing |
4.1 pp |
4.0 pp |
0.9 pp |
|
|
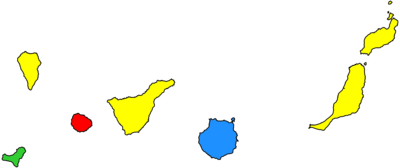
| Island-level units won by CC (yellow), PP (blue), PSOE (red) and AHI (green) |
|
|
The 1999 Canarian parliamentary election was held on Sunday, 13 June 1999, to elect the 5th Canarian Parliament, the unicameral regional legislature of the Spanish autonomous community of the Canary Islands. At stake were all 60 seats in the Parliament, determining the President of the Canary Islands.
Electoral system
The 60 members of the Canarian Parliament were elected in 7 multi-member districts using the D'Hondt method and a closed-list proportional representation system. Unlike other regions, districts did not coincide with provincial limits, being determined by law for each of the main islands to become a district of its own. The electoral system came regulated under the Autonomous Statute of Autonomy. Each district was assigned a fixed set of seats, distributed as follows: El Hierro (3), Fuerteventura (7), Gran Canaria (15), La Gomera (4), La Palma (8), Lanzarote (8) and Tenerife (15).
Voting was on the basis of universal suffrage in a secret ballot. Only lists polling above 30% of the total vote in each district or above 6% in all of the community (which include blank ballots—for none of the above) were entitled to enter the seat distribution.[1]
Results
Overall
← Summary of the 13 June 1999 Canarian Parliament election results →
| |
| Party |
Vote |
Seats |
| Votes |
% |
±pp |
Won |
+/− |
|
Canarian Coalition (CC) |
306,658 | 36.93 | 4.13 |
24 | 3 |
|
People's Party (PP) |
225,316 | 27.13 | 3.94 |
15 | 3 |
|
Spanish Socialist Workers' Party (PSOE) |
199,503 | 24.03 | 0.95 |
19 | 3 |
| |
|
Canarian Nationalist Federation (FNC) |
39,947 | 4.81 | 1.81 |
0 | 4 |
|
Canarian United Left (IUC) |
22,768 | 2.74 | 2.36 |
0 | ±0 |
|
The Greens of Canarias (LV) |
12,146 | 1.46 | New |
0 | ±0 |
|
Centrist Union-Democratic and Social Centre (UC-CDS) |
4,442 | 0.53 | 0.14 |
0 | ±0 |
|
Independent Herrenian Group (AHI) |
2,773 | 0.33 | 0.07 |
2 | 1 |
|
Humanist Party (PH) |
1,346 | 0.16 | 0.04 |
0 | ±0 |
|
Nationalist Maga Alternative (AMAGA) |
864 | 0.10 | New |
0 | ±0 |
|
Canarian Alternative-Canarias Independent Citizens (AC-CICA) |
806 | 0.10 | New |
0 | ±0 |
|
Canarian Pensionist Tagoror (TPC) |
692 | 0.08 | New |
0 | ±0 |
|
Fuerteventura People's Platform (PPF) |
533 | 0.06 | New |
0 | ±0 |
|
Blank ballots |
12,558 | 1.51 | 0.37 |
|
| |
| Total |
830,352 | 100.00 | |
60 | ±0 |
| |
| Valid votes |
830,352 | 99.42 | 0.01 |
|
| Invalid votes |
4,829 | 0.58 | 0.01 |
| Votes cast / turnout |
835,181 | 62.74 | 1.46 |
| Abstentions |
495,929 | 37.26 | 1.46 |
| Registered voters |
1,331,110 | |
| |
| Source: Argos Information Portal |
| Vote share |
|---|
|
|
|
|
|
| CC |
|
36.93% |
| PP |
|
27.13% |
| PSOE |
|
24.03% |
| FNC |
|
4.81% |
| IUC |
|
2.74% |
| LV |
|
1.46% |
| AHI |
|
0.33% |
| Others |
|
1.05% |
| Blank ballots |
|
1.51% |
| Parliamentary seats |
|---|
|
|
|
|
|
| CC |
|
40.00% |
| PSOE |
|
31.67% |
| PP |
|
25.00% |
| AHI |
|
3.33% |
References