United States presidential election in New York, 2012
| | ||||||||||||||||||||||||||||||||
| ||||||||||||||||||||||||||||||||
| ||||||||||||||||||||||||||||||||
|
| ||||||||||||||||||||||||||||||||
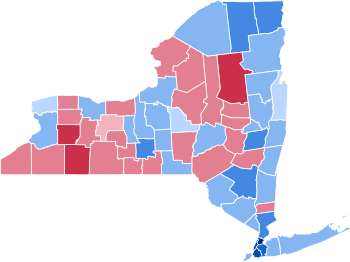
| County Results
Obama—>90%
Obama—80-90%
Obama—70-80%
Obama—60-70%
Obama—50-60%
Obama—<50%
Romney—<50%
Romney—50-60%
Romney—60-70% | ||||||||||||||||||||||||||||||||
| ||||||||||||||||||||||||||||||||
2012 U.S. Presidential Election |
|---|
| Democratic Party |
| Republican Party |
|
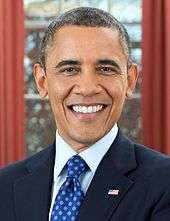
The 2012 United States presidential election in New York took place on November 6, 2012 as part of the 2012 General Election in which all 50 states plus The District of Columbia participated. New York voters chose 29 electors to represent them in the Electoral College via a popular vote pitting incumbent Democratic President Barack Obama and his running mate, Vice President Joe Biden, against Republican challenger and former Massachusetts Governor Mitt Romney and his running mate, Congressman Paul Ryan.
On election day, Barack Obama carried the state of New York by a landslide margin, winning 63.35% of the vote to Mitt Romney's 35.17%.[1] As in previous elections, the Democratic ticket racked up large margins in the heavily populated New York City area, as well as in upstate cities like Buffalo, Rochester, Albany, and the college town of Ithaca. The Republicans won only in some rural parts of upstate and western New York. New York was one of only six states to swing in President Obama's favor from 2008 to 2012, giving him the largest percentage of the vote for any presidential candidate in the state since 1964 and the second largest Democratic vote share in the state in history.
General election
Candidate Ballot Access:
- Mitt Romney/Paul Ryan, Republican
- Barack Obama/Joseph Biden, Democratic
- Gary Johnson/James P. Gray, Libertarian
- Jill Stein/Cheri Honkala, Green
- Virgil Goode/Jim Clymer, Constitution
- Peta Lindsay/Yari Osorio, Party for Socialism and Liberation
Write-In Candidate Access:
- Rocky Anderson/Luis J. Rodriguez, Justice
Results
| United States presidential election in New York, 2012 | ||||||
|---|---|---|---|---|---|---|
| Party | Candidate | Running mate | Votes | Percentage | Electoral votes | |
| Democratic | Barack Obama | 4,337,622 | 61.25% | |||
| Working Families | Barack Obama | 148,119 | 2.09% | |||
| Total | Barack Obama | Joe Biden | 4,485,877 | 63.35% | 29 | |
| Republican | Mitt Romney | 2,228,060 | 31.46% | |||
| Conservative | Mitt Romney | 262,371 | 3.71% | |||
| Total | Mitt Romney | Paul Ryan | 2,490,496 | 35.17% | 0 | |
| Libertarian | Gary Johnson | Jim Gray | 47,256 | 0.67% | 0 | |
| Green | Jill Stein | Cheri Honkala | 39,982 | 0.56% | 0 | |
| Write-Ins | Write-Ins | 9,076 | 0.13% | 0 | ||
| Constitution | Virgil Goode | Jim Clymer | 6,274 | 0.09% | 0 | |
| Socialism and Liberation | Peta Lindsay | Yari Osorio | 2,050 | 0.03% | 0 | |
| Justice (Write-in) | Rocky Anderson (Write-in) | Luis J. Rodriguez | 217 | >0.01% | 0 | |
| Freedom Socialist (Write-in) | Stephen Durham | Christina López | 34 | >0.01% | 0 | |
| America's (Write-in) | Tom Hoefling | J.D. Ellis | 34 | >0.01% | 0 | |
| Socialist Workers (Write-in) | James Harris | Maura DeLuca | 27 | >0.01% | 0 | |
| Socialist Equality (Write-in) | Jerry White | Phyllis Scherrer | 19 | >0.01% | 0 | |
| Twelve Visions (Write-in) | Jill Reed | Tom Cary | 12 | >0.01% | 0 | |
| American Third Position (Write-in) | Merlin Miller | Virginia Abernethy | 6 | >0.01% | 0 | |
| Totals | 7,081,536 | 100.00% | 29 | |||
| Voter Turnout (Registered) | 59.2% | |||||
Geographic Breakdown
The politics of New York State are dominated by the heavily populated area of New York City, which Barack Obama won in an historic landslide, taking over 80% of the vote and sweeping all 5 boroughs. Obama took 1,995,241 votes in New York City, to Mitt Romney's 436,889, giving Obama 81.19% of the vote to Romney's 17.78%. No other presidential candidate of either party has ever received more than 80% of the vote in New York City.
Discounting New York City's votes, Obama still would have carried New York State, but by a closer margin. Excluding New York City, Obama's vote total in the state was 2,490,636 to Romney's 2,053,607, giving Obama a 54.03%-44.54% win outside of NYC.
Results by county
| County | Obama% | Obama# | Romney% | Romney# | Johnson% | Johnson# | Stein% | Stein# | Others% | Others# | Total |
|---|---|---|---|---|---|---|---|---|---|---|---|
| Bronx | 91.45% | 339,211 | 8.08% | 29,967 | 0.16% | 608 | 0.21% | 774 | 0.10% | 378 | 370,938 |
| New York (Manhattan) | 83.75% | 502,674 | 14.92% | 89,559 | 0.52% | 3,104 | 0.64% | 3,860 | 0.17% | 1,094 | 600,291 |
| Kings (Brooklyn) | 82.02% | 604,443 | 16.90% | 124,551 | 0.34% | 2,500 | 0.60% | 4,411 | 0.15% | 1,077 | 736,982 |
| Queens | 79.08% | 470,732 | 19.92% | 118,589 | 0.40% | 2,375 | 0.41% | 2,465 | 0.18% | 1,084 | 595,245 |
| Tompkins | 68.68% | 27,244 | 28.00% | 11,107 | 1.00% | 395 | 2.10% | 834 | 0.23% | 90 | 39,670 |
| Albany | 64.49% | 87,555 | 33.19% | 45,064 | 1.00% | 1,361 | 0.91% | 1,238 | 0.40% | 548 | 135,766 |
| Franklin | 62.09% | 9,894 | 36.02% | 5,740 | 0.73% | 116 | 0.67% | 106 | 0.49% | 78 | 15,934 |
| Westchester | 61.99% | 240,785 | 36.84% | 143,122 | 0.53% | 2,042 | 0.42% | 1,627 | 0.22% | 871 | 388,447 |
| Clinton | 61.85% | 18,961 | 36.26% | 11,115 | 0.85% | 260 | 0.63% | 193 | 0.42% | 127 | 30,656 |
| Ulster | 60.10% | 47,065 | 37.24% | 29,162 | 0.96% | 751 | 1.19% | 935 | 0.52% | 402 | 78,315 |
| Onondaga | 59.72% | 122,254 | 38.51% | 78,831 | 0.83% | 1,697 | 0.77% | 1,584 | 0.17% | 351 | 204,717 |
| Essex | 58.53% | 9,784 | 39.76% | 6,647 | 0.80% | 134 | 0.64% | 107 | 0.27% | 45 | 16,717 |
| Monroe | 57.97% | 193,501 | 39.95% | 133,362 | 1.07% | 3,572 | 0.63% | 2,101 | 0.38% | 1,277 | 333,813 |
| St. Lawrence | 57.41% | 21,353 | 40.70% | 15,138 | 0.74% | 276 | 0.61% | 227 | 0.53% | 197 | 37,191 |
| Erie | 57.31% | 237,356 | 40.97% | 169,675 | 0.86% | 3,562 | 0.70% | 2,898 | 0.17% | 704 | 414,195 |
| Schenectady | 56.74% | 36,844 | 40.92% | 26,568 | 1.07% | 692 | 0.79% | 514 | 0.48% | 315 | 64,933 |
| Columbia | 55.69% | 16,221 | 41.97% | 12,225 | 1.03% | 299 | 0.89% | 259 | 0.43% | 125 | 29,129 |
| Rensselaer | 55.02% | 37,408 | 42.82% | 29,113 | 1.11% | 754 | 0.90% | 612 | 0.15% | 103 | 67,990 |
| Cayuga | 54.56% | 17,007 | 43.16% | 13,454 | 0.91% | 285 | 0.78% | 243 | 0.58% | 180 | 31,169 |
| Sullivan | 53.73% | 15,268 | 44.71% | 12,705 | 0.69% | 195 | 0.66% | 188 | 0.21% | 59 | 28,415 |
| Seneca | 53.48% | 7,094 | 44.39% | 5,889 | 0.83% | 110 | 0.76% | 101 | 0.54% | 72 | 13,266 |
| Cortland | 53.41% | 10,482 | 44.31% | 8,695 | 0.95% | 187 | 0.82% | 161 | 0.50% | 99 | 19,624 |
| Nassau | 53.28% | 302,695 | 45.64% | 259,308 | 0.53% | 2,998 | 0.36% | 2,068 | 0.19% | 1,082 | 568,151 |
| Dutchess | 52.80% | 65,312 | 45.29% | 56,025 | 0.89% | 1,105 | 0.63% | 785 | 0.39% | 478 | 123,705 |
| Rockland | 52.78% | 65,793 | 46.07% | 57,428 | 0.51% | 631 | 0.38% | 476 | 0.25% | 317 | 124,645 |
| Oswego | 52.73% | 23,515 | 44.81% | 19,980 | 1.00% | 447 | 0.85% | 379 | 0.61% | 270 | 44,591 |
| Orange | 52.13% | 73,315 | 46.48% | 65,367 | 0.75% | 1,049 | 0.50% | 700 | 0.14% | 197 | 140,628 |
| Broome | 51.46% | 41,970 | 46.15% | 37,641 | 1.12% | 915 | 0.89% | 723 | 0.39% | 316 | 81,565 |
| Suffolk | 51.17% | 304,079 | 47.48% | 282,131 | 0.66% | 3,947 | 0.43% | 2,528 | 0.27% | 1,581 | 594,266 |
| Richmond (Staten Island) | 50.71% | 78,181 | 48.14% | 74,223 | 0.58% | 899 | 0.34% | 519 | 0.23% | 358 | 154,180 |
| Otsego | 50.20% | 12,117 | 47.48% | 11,461 | 0.88% | 212 | 0.99% | 238 | 0.46% | 111 | 24,139 |
| Saratoga | 50.19% | 52,957 | 47.75% | 50,382 | 1.09% | 1,147 | 0.62% | 651 | 0.35% | 373 | 105,510 |
| Warren | 50.06% | 14,806 | 47.73% | 14,119 | 1.05% | 312 | 0.74% | 220 | 0.41% | 121 | 29,578 |
| Washington | 49.89% | 11,523 | 48.00% | 11,085 | 0.96% | 222 | 0.77% | 177 | 0.38% | 88 | 23,095 |
| Niagara | 49.42% | 43,986 | 48.58% | 43,240 | 0.97% | 864 | 0.63% | 560 | 0.41% | 363 | 89,013 |
| Madison | 49.37% | 13,871 | 48.49% | 13,622 | 1.06% | 297 | 0.85% | 238 | 0.23% | 66 | 28,094 |
| Ontario | 48.25% | 23,087 | 49.78% | 23,820 | 1.19% | 571 | 0.61% | 294 | 0.17% | 81 | 47,853 |
| Chemung | 47.98% | 16,797 | 50.31% | 17,612 | 0.89% | 310 | 0.43% | 151 | 0.40% | 140 | 35,010 |
| Jefferson | 47.89% | 17,099 | 50.75% | 18,122 | 0.76% | 271 | 0.42% | 151 | 0.18% | 65 | 35,708 |
| Yates | 47.53% | 4,488 | 50.82% | 4,798 | 0.73% | 69 | 0.71% | 67 | 0.21% | 20 | 9,442 |
| Chenango | 47.20% | 9,116 | 50.29% | 9,713 | 1.13% | 218 | 0.81% | 157 | 0.57% | 110 | 19,314 |
| Montgomery | 46.70% | 8,493 | 51.33% | 9,334 | 0.89% | 161 | 0.51% | 93 | 0.58% | 105 | 18,186 |
| Oneida | 46.68% | 40,468 | 51.36% | 44,530 | 0.94% | 819 | 0.58% | 502 | 0.44% | 381 | 86,700 |
| Schuyler | 45.10% | 3,674 | 52.55% | 4,281 | 0.98% | 80 | 0.92% | 75 | 0.44% | 36 | 8,146 |
| Chautauqua | 45.05% | 23,812 | 52.92% | 27,971 | 0.95% | 504 | 0.61% | 324 | 0.46% | 241 | 52,852 |
| Herkimer | 45.02% | 11,273 | 53.04% | 13,282 | 1.03% | 259 | 0.69% | 172 | 0.22% | 54 | 25,040 |
| Lewis | 44.90% | 4,724 | 53.71% | 5,651 | 0.77% | 81 | 0.48% | 51 | 0.14% | 15 | 10,522 |
| Delaware | 44.55% | 8,304 | 53.32% | 9,938 | 0.91% | 170 | 1.07% | 199 | 0.14% | 27 | 18,638 |
| Wayne | 44.30% | 16,635 | 53.43% | 20,060 | 1.13% | 424 | 0.59% | 222 | 0.55% | 206 | 37,547 |
| Putnam | 44.00% | 19,512 | 54.31% | 24,083 | 0.90% | 397 | 0.47% | 209 | 0.32% | 144 | 44,345 |
| Livingston | 43.72% | 11,705 | 53.97% | 14,448 | 1.19% | 318 | 0.65% | 175 | 0.46% | 124 | 26,770 |
| Greene | 43.58% | 8,922 | 54.17% | 11,089 | 1.13% | 231 | 0.68% | 140 | 0.44% | 90 | 20,472 |
| Fulton | 43.47% | 8,607 | 54.62% | 10,814 | 0.80% | 159 | 0.56% | 111 | 0.55% | 108 | 19,799 |
| Cattaraugus | 42.49% | 12,649 | 55.66% | 16,569 | 0.92% | 274 | 0.68% | 201 | 0.25% | 74 | 29,767 |
| Tioga | 41.39% | 8,940 | 56.09% | 12,117 | 1.11% | 240 | 0.80% | 172 | 0.61% | 132 | 21,601 |
| Schoharie | 41.09% | 5,427 | 56.54% | 7,467 | 0.98% | 129 | 0.82% | 108 | 0.57% | 76 | 13,207 |
| Steuben | 40.97% | 15,787 | 56.98% | 21,954 | 0.97% | 373 | 0.60% | 232 | 0.48% | 185 | 38,531 |
| Orleans | 39.35% | 5,787 | 58.44% | 8,594 | 1.12% | 165 | 0.55% | 81 | 0.54% | 79 | 14,706 |
| Genesee | 38.80% | 9,601 | 59.03% | 14,607 | 1.47% | 363 | 0.46% | 115 | 0.24% | 60 | 24,746 |
| Allegany | 36.21% | 6,139 | 61.29% | 10,390 | 0.99% | 168 | 0.96% | 162 | 0.55% | 94 | 16,953 |
| Hamilton | 36.13% | 1,128 | 61.88% | 1,932 | 0.90% | 28 | 0.45% | 14 | 0.64% | 20 | 3,122 |
| Wyoming | 34.66% | 5,661 | 63.35% | 10,348 | 0.83% | 135 | 0.59% | 96 | 0.58% | 95 | 16,335 |
| Totals | 63.35% | 4,485,877 | 35.17% | 2,490,496 | 0.67% | 47,256 | 0.56% | 39,984 | 0.25% | 17,923 | 7,081,536 |
See full list of sources See full list of sources
Republican primary
| | |||||||||||||||||||||||||||||||||||||||||||||||
| |||||||||||||||||||||||||||||||||||||||||||||||
| |||||||||||||||||||||||||||||||||||||||||||||||
|
| |||||||||||||||||||||||||||||||||||||||||||||||
| New York results by county
Mitt Romney
(Note: Italicization indicates a withdrawn candidacy) | |||||||||||||||||||||||||||||||||||||||||||||||
| New York Republican primary, 2012[2] | |||||||
|---|---|---|---|---|---|---|---|
| Candidate | Votes | Percentage | Projected delegate count | ||||
| AP | CNN |
FOX | |||||
| |
118,912 | 62.42% | 92 | 92 | |||
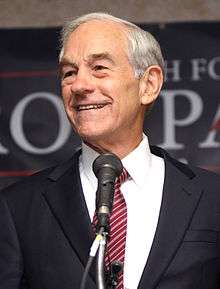
| Ron Paul | 27,699 | 14.54% | 0 | 0 | |||
| Newt Gingrich | 23,990 | 12.59% | 1 | 0 | |||
| Rick Santorum (withdrawn) | 18,997 | 9.97% | 0 | 0 | |||
| Blank | 810 | 0.43% | 0 | 0 | |||
| Void | 106 | 0.06% | 0 | 0 | |||
| Scattering | 1 | 0.00% | 0 | 0 | |||
| Unprojected delegates: | 2 | 3 | 95 | ||||
| Total: | 190,515 | 100.00% | 95 | 95 | 95 | ||
The New York Republican 2012 primary took place on April 24, 2012.[3][4]
By county, Romney won a plurality in every county, and a majority in all but six: Niagara, Cattaraugus, Wyoming, Orleans, Schuyler, Herkimer and Oswego.
Paul finished second in most counties. Santorum finished second in Otsego County. Gingrich finished second in two geographic areas: a cluster of counties in the Catskills and Hudson Valley (Orange, Rockland, Sullivan, and Westchester) and in most of the counties of Western New York (Allegany, Cattaraugus, Erie, Genesee, Niagara, and Wyoming), in addition to Herkimer and Oneida counties.[2] Gingrich's relative strength in Western New York, as well as in Herkimer, can be attributed to the continued popularity and efforts of Carl Paladino, who carried those counties in the previous gubernatorial election and campaigned on Gingrich's behalf. The majority of New York politicians had endorsed Romney while the primary election was still competitive.
See also
- Republican Party presidential debates, 2012
- Republican Party presidential primaries, 2012
- Results of the 2012 Republican Party presidential primaries
- New York Republican Party
References
- ↑ "2012 General Election Returns" (PDF). NYS Board of Elections. February 6, 2013. Retrieved March 4, 2013.
- 1 2 http://www.elections.ny.gov/NYSBOE/elections/2012/Primary/RepublicanPresidentialPrimaryCounty.pdf
- ↑ "Primary and Caucus Printable Calendar". CNN. Retrieved January 11, 2012.
- ↑ "Presidential Primary Dates" (PDF). Federal Election Commission. Retrieved January 23, 2012.
External links
- The Green Papers: for New York
- The Green Papers: Major state elections in chronological order


