United States presidential election in California, 1976
| | ||||||||||||||||||||||||||||||||
| ||||||||||||||||||||||||||||||||
| ||||||||||||||||||||||||||||||||
|
| ||||||||||||||||||||||||||||||||
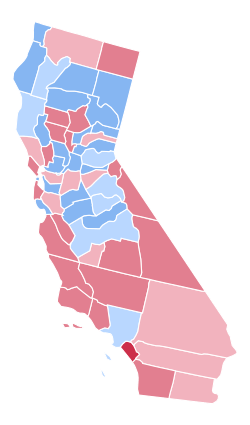
| County Results
Carter—50-60%
Carter—<50%
Ford—<50%
Ford—50-60%
Ford—60-70% | ||||||||||||||||||||||||||||||||
| ||||||||||||||||||||||||||||||||
| Elections in California | ||||||||||
|---|---|---|---|---|---|---|---|---|---|---|
 | ||||||||||
|
||||||||||
|
||||||||||
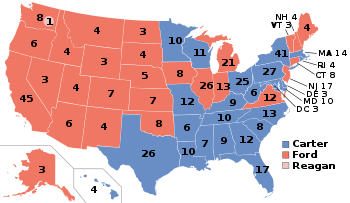
The 1976 United States presidential election in California refers to how California participated in the 1976 United States presidential election. California narrowly voted for the Republican incumbent, Gerald Ford, over the Democratic challenger, Jimmy Carter.
Ford won the state with a plurality of 49.35% of the vote to Carter's 47.57%, a victory margin of 1.78%. Carter performed more strongly in rural Northern California, winning many counties in California's Central Valley, while Ford performed more strongly in Southern California, sweeping every county there except Los Angeles County, which narrowly voted for Carter.
This was only the fifth time in California’s electoral history that it did not support the winning candidate from either party. This is also the last election where the Democratic candidate won the Presidency without carrying California.
Carter is the last Democrat to carry the counties of Amador, El Dorado, Lassen, Madera, Placer, Shasta, Sierra and Yuba, and the last to win a majority of the vote in Del Norte, Plumas and Tehama. Carter is also the last candidate from either party to carry Los Angeles by only a plurality, while Ford is the last Republican to win a majority of the vote in Marin (Ronald Reagan later won that county by plurality in 1980).
Results
| United States presidential election in California, 1976[1] | |||||
|---|---|---|---|---|---|
| Party | Candidate | Votes | Percentage | Electoral votes | |
| Republican | Gerald Ford (incumbent) | 3,882,244 | 49.35% | 45 | |
| Democratic | Jimmy Carter | 3,742,284 | 47.57% | 0 | |
| No party | Eugene McCarthy (write-in) | 58,412 | 0.74% | 0 | |
| Independent | Roger MacBride | 56,388 | 0.72% | 0 | |
| American Independent | Lester Maddox | 51,098 | 0.65% | 0 | |
| Peace and Freedom | Margaret Wright | 41,731 | 0.53% | 0 | |
| Independent | Peter Camejo | 17,259 | 0.22% | 0 | |
| Independent | Gus Hall | 12,766 | 0.16% | 0 | |
| No party | Thomas J. Anderson (write-in) | 4,565 | 0.06% | 0 | |
| No party | Jules Levin (write-in) | 222 | 0.00% | 0 | |
| No party | Write-ins | 74 | 0.00% | 0 | |
| No party | Ben Bubar (write-in) | 34 | 0.00% | 0 | |
| No party | Ernest Miller (write-in) | 26 | 0.00% | 0 | |
| No party | Frank Taylor (write-in) | 14 | 0.00% | 0 | |
| Invalid or blank votes | — | ||||
| Totals | 7,867,117 | 100.00% | 45 | ||
| Voter turnout | — | ||||
Results by county
| County | Ford | Votes | Carter | Votes | Others | Votes |
|---|---|---|---|---|---|---|
| Orange | 62.16% | 408,632 | 35.33% | 232,246 | 2.52% | 16,555 |
| Mono | 58.80% | 1,600 | 37.67% | 1,025 | 3.53% | 96 |
| Inyo | 58.23% | 3,905 | 39.29% | 2,635 | 2.48% | 166 |
| San Diego | 55.74% | 353,302 | 41.60% | 263,654 | 2.66% | 16,839 |
| Tulare | 54.52% | 31,864 | 43.72% | 25,551 | 1.76% | 1,027 |
| Sutter | 54.21% | 8,745 | 43.18% | 6,966 | 2.60% | 420 |
| Ventura | 53.20% | 82,670 | 44.10% | 68,529 | 2.70% | 4,201 |
| Colusa | 52.74% | 2,733 | 45.16% | 2,340 | 2.10% | 109 |
| Glenn | 52.67% | 4,094 | 45.04% | 3,501 | 2.29% | 178 |
| Marin | 52.52% | 53,425 | 42.86% | 43,590 | 4.62% | 4,700 |
| Kern | 52.29% | 58,023 | 45.57% | 50,567 | 2.14% | 2,371 |
| Napa | 51.83% | 20,839 | 44.89% | 18,048 | 3.28% | 1,318 |
| Butte | 51.77% | 28,400 | 44.12% | 24,203 | 4.10% | 2,251 |
| Modoc | 51.20% | 1,917 | 46.29% | 1,733 | 2.51% | 94 |
| San Luis Obispo | 51.17% | 27,785 | 45.91% | 24,926 | 2.92% | 1,587 |
| Monterey | 51.02% | 40,896 | 45.97% | 36,849 | 3.00% | 2,408 |
| San Benito | 50.87% | 3,398 | 46.74% | 3,122 | 2.40% | 160 |
| Santa Barbara | 50.83% | 60,922 | 45.91% | 55,018 | 3.26% | 3,904 |
| San Mateo | 50.63% | 117,338 | 44.40% | 102,896 | 4.97% | 11,507 |
| Alpine | 50.34% | 225 | 42.28% | 189 | 7.38% | 33 |
| Imperial | 49.94% | 10,618 | 48.18% | 10,244 | 1.88% | 400 |
| Kings | 49.65% | 8,263 | 48.44% | 8,061 | 1.91% | 318 |
| San Joaquin | 49.60% | 50,277 | 48.08% | 48,733 | 2.32% | 2,351 |
| San Bernardino | 49.49% | 113,265 | 47.90% | 109,636 | 2.61% | 5,984 |
| Santa Clara | 49.46% | 219,188 | 46.94% | 208,023 | 3.59% | 15,927 |
| Contra Costa | 49.35% | 126,598 | 48.24% | 123,742 | 2.41% | 6,194 |
| Riverside | 49.24% | 97,774 | 48.46% | 96,228 | 2.29% | 4,556 |
| Calaveras | 49.08% | 3,695 | 47.91% | 3,607 | 3.00% | 226 |
| Nevada | 48.40% | 8,170 | 46.95% | 7,926 | 4.65% | 785 |
| Siskiyou | 48.37% | 7,070 | 48.31% | 7,060 | 3.32% | 485 |
| Fresno | 48.10% | 72,533 | 49.71% | 74,958 | 2.20% | 3,314 |
| Los Angeles | 47.78% | 1,174,926 | 49.69% | 1,221,893 | 2.53% | 62,258 |
| Sonoma | 47.72% | 50,555 | 47.52% | 50,353 | 4.76% | 5,044 |
| El Dorado | 47.69% | 12,472 | 48.80% | 12,763 | 3.51% | 919 |
| Tuolumne | 46.94% | 6,104 | 49.93% | 6,492 | 3.13% | 407 |
| Mariposa | 46.61% | 2,012 | 48.48% | 2,093 | 4.91% | 212 |
| Amador | 46.13% | 3,699 | 50.35% | 4,037 | 3.52% | 282 |
| Merced | 46.08% | 14,842 | 51.65% | 16,637 | 2.26% | 729 |
| Madera | 45.96% | 6,844 | 51.20% | 7,625 | 2.84% | 423 |
| Trinity | 45.66% | 1,989 | 49.86% | 2,172 | 4.48% | 195 |
| Shasta | 45.63% | 17,273 | 50.72% | 19,200 | 3.65% | 1,381 |
| Mendocino | 45.49% | 9,784 | 49.53% | 10,653 | 4.98% | 1,072 |
| Del Norte | 45.29% | 2,481 | 50.91% | 2,789 | 3.80% | 208 |
| Placer | 45.03% | 18,154 | 52.16% | 21,026 | 2.81% | 1,131 |
| Stanislaus | 44.83% | 32,937 | 52.34% | 38,448 | 2.83% | 2,080 |
| Tehama | 44.81% | 6,110 | 51.27% | 6,990 | 3.92% | 535 |
| Yuba | 44.74% | 5,496 | 52.51% | 6,451 | 2.75% | 338 |
| Sacramento | 44.63% | 123,110 | 52.27% | 144,203 | 3.10% | 8,563 |
| Lake | 44.46% | 5,462 | 51.88% | 6,374 | 3.65% | 449 |
| Plumas | 43.94% | 2,884 | 52.25% | 3,429 | 3.81% | 250 |
| Sierra | 43.15% | 680 | 53.36% | 841 | 3.49% | 55 |
| Santa Cruz | 43.09% | 31,872 | 51.06% | 37,772 | 5.85% | 4,325 |
| Lassen | 42.97% | 3,007 | 54.32% | 3,801 | 2.72% | 190 |
| Yolo | 42.42% | 18,376 | 54.33% | 23,533 | 3.25% | 1,408 |
| Solano | 42.40% | 26,136 | 54.64% | 33,682 | 2.96% | 1,826 |
| Humboldt | 41.58% | 18,034 | 54.18% | 23,500 | 4.24% | 1,838 |
| San Francisco | 40.31% | 103,561 | 52.06% | 133,733 | 7.63% | 19,594 |
| Alameda | 38.09% | 155,280 | 57.89% | 235,988 | 4.03% | 16,413 |
References
- ↑ "1976 Presidential General Election Results - California". Dave Leip's U.S. Election Atlas. Retrieved 2008-08-25.


