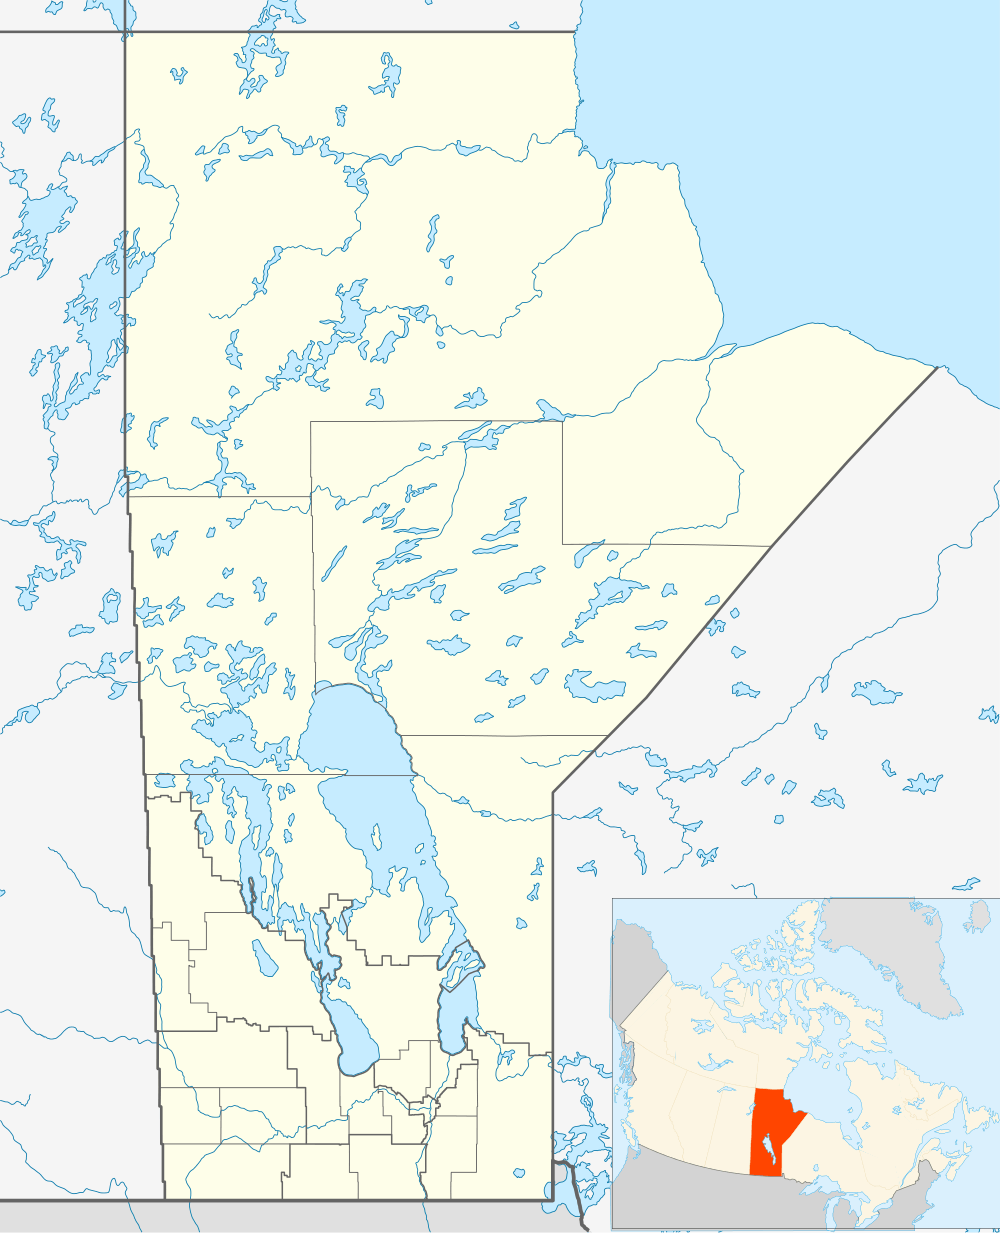
Pierson, Manitoba
| Pierson | |
|---|---|
| Local urban district | |
 Pierson Location of Pierson in Manitoba | |
| Coordinates: 49°10′48″N 101°15′45″W / 49.18000°N 101.26250°WCoordinates: 49°10′48″N 101°15′45″W / 49.18000°N 101.26250°W | |
| Country | Canada |
| Province | Manitoba |
| Region | Westman |
| Rural Municipality | R.M. of Edward |
| Elevation | 253.6 m (832 ft) |
| Time zone | CST (UTC-6) |
| • Summer (DST) | CDT (UTC-5) |
| Area code(s) | 204 |
Pierson is an unincorporated community recognized as a local urban district[1] located in the Rural Municipality of Two Borders in southwestern Manitoba.
Pierson is home to the Carnival of Crafts which averages an attendance of 1,700 people. This event takes place at the Edward Sports Centre on the first Saturday in October.
Climate
Pierson has a humid continental climate with great differences between summer and winter. The regime is typical of southern Manitoba, the northern edges of North Dakota and the surrounding border region.
| Climate data for Pierson | |||||||||||||
|---|---|---|---|---|---|---|---|---|---|---|---|---|---|
| Month | Jan | Feb | Mar | Apr | May | Jun | Jul | Aug | Sep | Oct | Nov | Dec | Year |
| Record high °C (°F) | 8.9 (48) |
17.5 (63.5) |
23.9 (75) |
34.0 (93.2) |
39.4 (102.9) |
41.7 (107.1) |
42.8 (109) |
40.0 (104) |
37.2 (99) |
33.0 (91.4) |
22.8 (73) |
17.2 (63) |
42.8 (109) |
| Average high °C (°F) | −9 (16) |
−5.7 (21.7) |
0.9 (33.6) |
12.1 (53.8) |
19.1 (66.4) |
23.6 (74.5) |
26.7 (80.1) |
26.6 (79.9) |
20.2 (68.4) |
11.6 (52.9) |
0.5 (32.9) |
−7 (19) |
10 (50) |
| Daily mean °C (°F) | −14.2 (6.4) |
−11.0 (12.2) |
−4.2 (24.4) |
5.3 (41.5) |
11.9 (53.4) |
16.8 (62.2) |
19.6 (67.3) |
18.9 (66) |
12.9 (55.2) |
5.1 (41.2) |
−4.5 (23.9) |
−11.9 (10.6) |
3.7 (38.7) |
| Average low °C (°F) | −19.5 (−3.1) |
−16.2 (2.8) |
−9.1 (15.6) |
−1.6 (29.1) |
4.7 (40.5) |
10.1 (50.2) |
12.3 (54.1) |
11.2 (52.2) |
5.6 (42.1) |
−1.4 (29.5) |
−9.4 (15.1) |
−16.8 (1.8) |
−2.5 (27.5) |
| Record low °C (°F) | −44.4 (−47.9) |
−47.8 (−54) |
−45.0 (−49) |
−26.1 (−15) |
−12.2 (10) |
−9.4 (15.1) |
−2.2 (28) |
−6.1 (21) |
−12.2 (10) |
−22.2 (−8) |
−33.3 (−27.9) |
−42.0 (−43.6) |
−47.8 (−54) |
| Average precipitation mm (inches) | 22.9 (0.902) |
13.9 (0.547) |
23.1 (0.909) |
27.5 (1.083) |
55.1 (2.169) |
77.7 (3.059) |
70.4 (2.772) |
51.6 (2.031) |
37.3 (1.469) |
33.2 (1.307) |
22.7 (0.894) |
21.9 (0.862) |
457.3 (18.004) |
| Source: Environment Canada[2] | |||||||||||||
External links
References
- ↑ "Local Urban Districts Regulation". Government of Manitoba. April 23, 2016. Retrieved April 24, 2016.
- ↑ "Canadian Climate Normals 1981-2010". Environment Canada.
 |
Pipestone |  | ||
| Gainsborough, Saskatchewan | |
Melita | ||
| ||||
| | ||||
| Lyleton Antler, North Dakota |
This article is issued from Wikipedia - version of the 11/27/2016. The text is available under the Creative Commons Attribution/Share Alike but additional terms may apply for the media files.