Belgian monarchy referendum, 1950
 |
| This article is part of a series on the politics and government of Belgium |
| Constitution |
|
| Foreign relations |
A referendum on restoring Leopold III to the throne was held in Belgium on 12 March 1950. The proposal was approved by 57.68% of voters.[1]
Background
King Leopold went into exile in June 1944, when Heinrich Himmler ordered him to leave Belgium. Leopold was held by the Nazis in Strobl, Austria until early May 1945, when he was freed by members of the United States 106th Cavalry Group. Because of the political troubles surrounding his war time behaviour King Leopold remained in exile in Switzerland until 1950, his brother Prince Charles, Count of Flanders having been installed as Regent after the Liberation in 1944.
The Catholics, who generally supported the King's return, won a majority in the Belgian Senate during the general election of 26 June 1949. The Catholics formed a government with the Liberals. The date of the referendum (Consultation populaire) the King wanted was set by this government for 12 March 1950.
Socialist Leader Paul-Henri Spaak opposed holding a referendum. He foresaw that the vote for Leopold might fall between 55% and 65%, giving no decisive mandate for the king's return, and that the King would carry Flanders and lose Wallonia. In that case, said Spaak, "the government would not only have on its hands the King's abdication or return, it would also have to appease the anger, acerbity and rancor of Flanders or Wallonia."[2]
Results

The question voters were asked was:
- Dutch: "Zijt U de mening toegedaan dat Koning Leopold III de uitoefening van zijn grondwettelijke machten zou hernemen?"
- French: "Êtes-vous d'avis que le Roi Leopold III reprenne l'exercice de ses pouvoirs constitutionnels ?"
- Translation: "Are you of the opinion that King Leopold III should resume the exercise of his constitutional powers?"
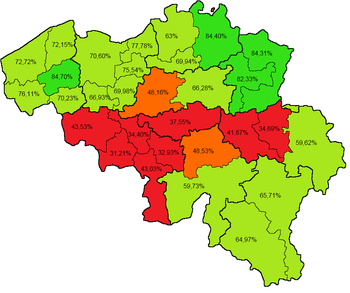
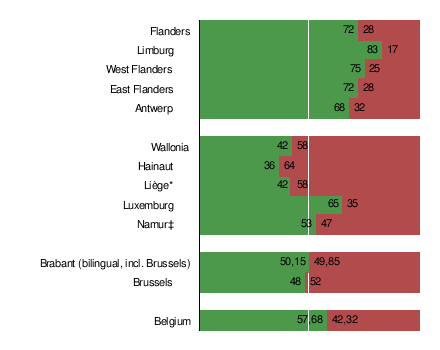
A majority voted in favour of Leopold's return. In Flanders, 72% voted in favour. In Wallonia, 58% voted against. In Brussels, only 52% voted against.[3]
| Choice | Votes | % |
|---|---|---|
| For | 2,933,382 | 57.68 |
| Against | 2,151,881 | 42.32 |
| Invalid/blank votes | 151,477 | – |
| Total | 5,236,740 | 100 |
| Registered voters/turnout | 5,635,452 | 92.92 |
| Source: Direct Democracy | ||
By area
These are the results by electoral arrondissement(s):[4][5]
| Arrondissement | Province | Total ballots cast | Invalid ballots | YES | % | NO | % |
|---|---|---|---|---|---|---|---|
| Antwerpen | Antwerp | 484,936 | 12,236 | 297,863 | 63.0% | 174,837 | 37.0% |
| Mechelen | Antwerp | 156,099 | 3,905 | 106,450 | 69.9% | 45,744 | 30.1% |
| Turnhout | Antwerp | 134,684 | 3,678 | 110,576 | 84.4% | 20,430 | 15.6% |
| Brussels | Brabant | 832,087 | 26,773 | 387,914 | 48.2% | 417,400 | 51.8% |
| Leuven | Brabant | 197,540 | 7,530 | 125,944 | 66.3% | 64,066 | 33.7% |
| Nivelles | Brabant | 119,686 | 3,097 | 43,777 | 37.5% | 72,812 | 62.5% |
| Brugge | West Flanders | 119,573 | 3,677 | 83,623 | 72.2% | 32,273 | 27.8% |
| Veurne-Diksmuide-Oostende | West Flanders | 118,265 | 4,615 | 82,652 | 72.7% | 30,998 | 27.3% |
| Roeselare-Tielt | West Flanders | 116,945 | 3,372 | 96,196 | 84.7% | 17,377 | 15.3% |
| Kortrijk | West Flanders | 167,772 | 5,163 | 114,198 | 70.2% | 48,411 | 29.8% |
| Ieper | West Flanders | 74,101 | 3,011 | 54,109 | 76.1% | 16,981 | 23.9% |
| Gent-Eeklo | East Flanders | 328,298 | 9,792 | 224,874 | 70.6% | 93,632 | 29.4% |
| Sint-Niklaas | East Flanders | 111,048 | 1,833 | 84,955 | 77.8% | 24,260 | 22.2% |
| Dendermonde | East Flanders | 97,756 | 2,150 | 72,223 | 75.5% | 23,383 | 24.5% |
| Aalst | East Flanders | 145,994 | 2,924 | 100,130 | 70.0% | 42,940 | 30.0% |
| Oudenaarde | East Flanders | 73,500 | 2,371 | 47,607 | 66.9% | 23,522 | 33.1% |
| Mons | Hainaut | 162,250 | 4,467 | 49,243 | 31.2% | 108,540 | 68.8% |
| Soignies | Hainaut | 103,952 | 2,565 | 34,875 | 34.4% | 66,512 | 65.6% |
| Charleroi | Hainaut | 268,375 | 7,209 | 86,003 | 32.9% | 175,163 | 67.1% |
| Thuin | Hainaut | 82,540 | 2,294 | 34,529 | 43.0% | 45,717 | 57.0% |
| Tournai-Ath | Hainaut | 147,992 | 4,056 | 62,661 | 43.5% | 81,275 | 56.5% |
| Liège | Liège | 353,598 | 10,095 | 119,161 | 34.7% | 224,342 | 65.3% |
| Huy-Waremme | Liège | 109,286 | 3,132 | 44,445 | 41.9% | 61,709 | 58.1% |
| Verviers | Liège | 141,253 | 4,998 | 81,238 | 59.6% | 55,017 | 40.4% |
| Hasselt | Limburg | 109,472 | 3,513 | 87,241 | 82.3% | 18,718 | 17.7% |
| Tongeren-Maaseik | Limburg | 124,333 | 3,616 | 101,783 | 84.3% | 18,934 | 15.7% |
| Arlon-Marche-Bastogne | Luxembourg | 72,526 | 2,078 | 46,296 | 65.7% | 24,152 | 34.3% |
| Neufchâteau-Virton | Luxembourg | 59,223 | 1,595 | 37,443 | 65.0% | 20,185 | 35.0% |
| Namur | Namur | 135,600 | 3,495 | 64,112 | 48.5% | 67,993 | 51.5% |
| Dinant-Philippeville | Namur | 88,056 | 2,237 | 51,261 | 59.7% | 34,558 | 40.3% |
| Flanders (four Flemish provinces plus Leuven)[6] | 2,560,316 | 73,386 | 1,790,424 | 71.0% | 696,506 | 28.0% | |
| Wallonia (four Walloon provinces plus Nivelles)[7] | 1,844,337 | 51,318 | 755,044 | 42.1% | 1,037,975 | 57.9% | |
| Kingdom of Belgium | 5,236,740 | 151,477 | 2,933,382 | 57.7% | 2,151,881 | 42.3% | |


Aftermath
References
- ↑ Belgium, 12 March 1950: Return of King Leopold III Direct Democracy (German)
- ↑ "Belgium up in the air", Time, Monday, 20 March 1950
- ↑ Maps of the referendum's results Institut Destrée et Université de Liège Archived February 27, 2012, at the Wayback Machine.
- ↑ Paul Theunissen, 1950, Ontknoping van de koningskwestie, De Nederlandsche boekhandel, Anvers, Amsterdam, 1984, pp. 16-17. ISBN 90-289-0892-7 and La Revue Nouvelle, 15 avril 1950, pp. 379-385.
- ↑ Communication of the Minister of the Interior on the referendum, Senate, 13 March 1950
- ↑ Almost corresponding to the present-day five Flemish provinces making up the Flemish Region, except for Halle-Vilvoorde which was then part of the arrondissement of Brussels
- ↑ Corresponding to the present-day five Walloon provinces making up the Walloon Region