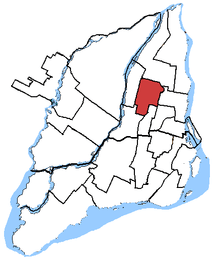
Saint-Léonard—Saint-Michel
Saint-Léonard—Saint Michel (formerly Saint-Léonard) is a federal electoral district in Quebec, Canada, that has been represented in the House of Commons of Canada since 1988. Its population in 2011 was 108,811.
Geography
The district includes the Borough of Saint Leonard, and the neighbourhood of Saint-Michel-Nord and the eastern part of the neighbourhood of Saint-Michel in the Borough of Villeray–Saint-Michel–Parc-Extension.
History
"Saint-Léonard" riding was first created in 1976 from parts of Maisonneuve—Rosemont, Mercier and Saint-Michel ridings. The name of the riding was changed in 1977 to Saint-Léonard—Anjou before an election was held. It consisted of the City of Saint-Léonard, the Town of Anjou, and part of the City of Montreal.
The neighbouring ridings are Rosemont—La Petite-Patrie, Papineau, Ahuntsic, Bourassa, Honoré-Mercier, and Hochelaga.
The current electoral district was created as "Saint-Léonard" riding in 1987 from parts of Gamelin and Saint-Léonard—Anjou ridings. In 1996, its name was changed to "Saint-Léonard—Saint-Michel".
This riding lost some territory to Papineau, and gained territory from Ahuntsic and Hochelaga during the 2012 electoral redistribution.
Members of Parliament
This riding has elected the following Members of Parliament:
Election results
Saint-Léonard—Saint-Michel, 1996-present
| Canadian federal election, 2015 |
| Party |
Candidate |
Votes | % | ∆% | Expenditures |
|
Liberal | Nicola Di Iorio | 28,835 | 64.73 | +22.56 | – |
|
New Democratic | Rosannie Filato | 6,611 | 14.85 | -17.15 | – |
|
Conservative | Jean Philippe Fournier | 4,957 | 11.13 | -2.5 | – |
|
Bloc Québécois | Steeve Gendron | 3,204 | 7.19 | -2.46 | $3,194.52 |
|
Green | Melissa Miscione | 805 | 1.81 | +0.04 | $19.00 |
|
Marxist–Leninist | Arezki Malek | 128 | 0.29 | -0.19 | – |
| Total valid votes/Expense limit |
44,531 | 100.0 | | $209,628.68 |
| Total rejected ballots |
689 | – | – |
| Turnout |
45,220 | 59.22 | +7.71 |
| Eligible voters |
76,531 |
| Source: Elections Canada[3][4] |
| Canadian federal election, 2008 |
| Party |
Candidate |
Votes | % | ∆% | Expenditures |
|
Liberal | Massimo Pacetti | 21,652 | 57.25 | -0.08 | $58,674 |
|
Conservative | Lucie Le Tourneau | 5,627 | 14.88 | +0.47 | $28,585 |
|
Bloc Québécois | Farid Salem | 5,146 | 13.60 | -5.14 | $8,509 |
|
New Democratic | Laura Colella | 4,039 | 10.68 | +3.86 | $2,036 |
|
Green | Frank Monteleone | 1,063 | 2.81 | +0.50 | |
|
Marxist–Leninist | Garnet Colly | 165 | 0.43 | -0.09 | |
|
Independent | Joseph Young | 122 | 0.32 | – | $743 |
| Total valid votes/Expense limit |
37,814 | 100.00 | $81,851 |
| Total rejected ballots |
604 | 1.57 | +0.05 |
| Turnout |
38,418 | 53.59 |
| |
Liberal hold |
Swing |
-0.3 |
|
| Canadian federal election, 2006 |
| Party |
Candidate |
Votes | % | ∆% | Expenditures |
|
Liberal | Massimo Pacetti | 23,705 | 57.17 | −6.73 | $66,670 |
|
Bloc Québécois | Justine Charlemagne | 7,772 | 18.74 | −3.11 | $20,789 |
|
Conservative | Ercolano Pingiotti | 5,975 | 14.41 | +9.13 | $15,672 |
|
New Democratic | Laura Colella | 2,831 | 6.83 | +0.85 | $4,702 |
|
Green | Pierre-Louis Parant | 961 | 2.32 | −0.01 | none listed |
|
Marxist–Leninist | Stéphane Chénier | 219 | 0.53 | −0.13 | none listed |
| Total valid votes |
41,463 | 100.00 |
| Total rejected ballots |
640 |
| Turnout |
42,103 | 57.00 | +2.48 |
| Electors on the lists |
73,869 |
| Sources: Official Results, Elections Canada and Financial Returns, Elections Canada. |
| Canadian federal election, 2004 |
| Party |
Candidate |
Votes | % | ∆% | Expenditures |
|
Liberal | Massimo Pacetti | 25,884 | 63.90 | −12.76 | $63,440 |
|
Bloc Québécois | Paul-Alexis François | 8,852 | 21.85 | +7.40 | $9,289 |
|
New Democratic | Laura Colella | 2,422 | 5.98 | | $6,007 |
|
Conservative | Payam Eslami | 2,138 | 5.28 | −0.11 | $5,647 |
|
Green | Ricardo Fellicetti | 944 | 2.33 | | none listed |
|
Marxist–Leninist | Stéphane Chénier | 267 | 0.66 | | none listed |
| Total valid votes |
40,507 | 100.00 |
| Total rejected ballots |
855 |
| Turnout |
41,362 | 54.52 |
| Electors on the lists |
75,864 |
| Note: Conservative vote is compared to the Progressive Conservative vote in 2000 election. |
| Sources: Official Results, Elections Canada and Financial Returns, Elections Canada. Percentage change totals are in relation to the 2000 general election. |
Saint-Léonard, 1987-1996
See also
References
Notes
|
|---|
|
| Until 2015 | |
|---|
|
| Until 2006 | |
|---|
|
| Until 2004 | |
|---|
|
| Until 2000 | |
|---|
|
| Until 1997 | |
|---|
|
| Until 1993 | |
|---|
|
| Until 1988 | |
|---|
|
| Until 1984 | |
|---|
|
| Until 1980 | |
|---|
|
| Until 1979 | |
|---|
|
| Until 1974 | |
|---|
|
| Until 1972 | |
|---|
|
| Until 1968 | |
|---|
|
| Until 1962 | |
|---|
|
| Until 1953 | |
|---|
|
| Until 1949 | |
|---|
|
| Until 1935 | |
|---|
|
| Until 1925 | |
|---|
|
| Until 1917 | |
|---|
|
| Before 1900 | |
|---|
Coordinates: 45°35′20″N 73°35′20″W / 45.589°N 73.589°W / 45.589; -73.589

.png)