Oklahoma's 5th congressional district
| Oklahoma's 5th congressional district | |
|---|---|
|
Oklahoma's 5th congressional district - since January 3, 2013. | |
| Current Representative | Steve Russell (R) |
| Distribution |
|
| Population (2000) | 690,131 |
| Median income | 33,893 |
| Ethnicity |
|
| Occupation | |
| Cook PVI | R+13[1] |
Oklahoma's Fifth Congressional District is a U.S. congressional district in Oklahoma, which elects a representative to the United States House of Representatives. It borders all of the other congressional districts in the state except the 1st District. It is densely populated and covers almost all of Oklahoma County (except a small sliver located in the 4th District) and all of Pottawatomie and Seminole counties.
Principal cities in the district include Oklahoma City (the state capital), Edmond, Shawnee, and Seminole.
The district is currently represented by Republican Steve Russell.
History
The district has been held by a Republican since January 23, 1975, when Democrat John Jarman changed political parties.[2] Before Jarman, the seat had leaned Democratic since 1931.
George W. Bush received 64 percent of the vote in this district in 2004.
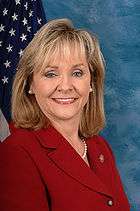
Republican Mary Fallin won 60 percent of the vote in the 2006 election.[3]
Demographics
According to the 2000 Census, the district is 87.53 percent urban, 26.17 percent non-white, and has a population that is 8.26 percent Latino and 6.76 percent foreign-born.[4] Only 2.74 percent of adults working in the district commute using public transportation, on a bike or on foot. 8.49 percent of adults aged 25 and older in the district have a Master's, PhD or Professional Degree.[4]
Recent election results from state-wide races
| Year | Office | District winner and results |
|---|---|---|
| 2000 | President | Bush 62% - 38% |
| 2004 | President | Bush 64% - 36% |
| 2008 | President | McCain 59% - 41% |
| 2012 | President | Romney 67% - 33% |
| 2012 | President | Romney 67% - 33% |
| 2012 | President | Romney 67% - 33% |
| 2016 | President | Trump 53% - 40%[5] |
List of representatives
Historical district boundaries

See also
References
- ↑ "Partisan Voting Index Districts of the 113th Congress: 2004 & 2008" (PDF). The Cook Political Report. 2012. Retrieved 2013-01-10.
- ↑ "Congressman leaves Democratic Party". Lodi News-Sentinel. Google News Archives. United Press International. January 24, 1975. p. 9.
- ↑ "2006 General Election Results" Archived June 17, 2007, at the Wayback Machine. Oklahoma Election Board (accessed March 15, 2010)
- 1 2 Rep. Mary Fallin: District Demographics, That's My Congress (accessed May 11, 2010).
- ↑ http://www.dailykos.com/stories/2016/11/16/1600382/-Democrats-get-crushed-in-the-Sooner-State-but-Oklahoma-City-is-trending-bluer
- ↑ http://bioguide.congress.gov/scripts/biodisplay.pl?index=S000543
- Martis, Kenneth C. (1989). The Historical Atlas of Political Parties in the United States Congress. New York: Macmillan Publishing Company.
- Martis, Kenneth C. (1982). The Historical Atlas of United States Congressional Districts. New York: Macmillan Publishing Company.
- Congressional Biographical Directory of the United States 1774–present
Coordinates: 35°24′N 97°12′W / 35.4°N 97.2°W
.tif.png)



.jpg)

