Hess diagram
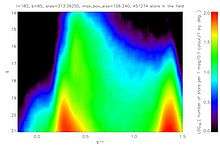
A Hess diagram plots the relative density of occurrence of stars at differing color–magnitude positions of the Hertzsprung–Russell diagram for a given galaxy. The diagram is named after R. Hess who originated it in 1924.[1] Its use dates back to at least 1948.[2]
See also
References
- ↑ R. Hess (Heß) (1924). "Die Verteilungsfunktion der absoluten Helligkeiten in ihrer Abhängigkeit vom Spektrum". Probleme der Astronomie. Festschrift fur Hugo v. Seeliger. Springer, Berlin. p. 265.
- ↑ Gaposchkin, Cecilia Payne (1948). "The connection of motion with intrinsic variability.". Astronomical Journal. 53: 193. Bibcode:1948AJ.....53..193G. doi:10.1086/106093.
This article is issued from Wikipedia - version of the 2/19/2015. The text is available under the Creative Commons Attribution/Share Alike but additional terms may apply for the media files.