Harry Markowitz
| Harry Markowitz | |
|---|---|
| Born |
August 24, 1927 Chicago, Illinois, USA |
| Nationality | United States |
| Institution |
Harry Markowitz Company Rady School of Management at the University of California, San Diego Baruch College of the City University of New York RAND Corporation Cowles Commission |
| Field | Financial economics |
| School or tradition | Chicago School of Economics |
| Alma mater | University of Chicago, (PhD) |
| Doctoral advisor |
Milton Friedman Jacob Marschak |
| Influences |
Tjalling Koopmans Leonard Savage |
| Contributions |
Modern portfolio theory Efficient/ Markowitz Frontier Sparse Matrix Methods SIMSCRIPT |
| Awards |
John von Neumann Theory Prize (1989) The Sveriges Riksbank Prize in Economic Sciences in Memory of Alfred Nobel (1990) |
| Information at IDEAS / RePEc | |
Harry Max Markowitz (born August 24, 1927) is an American economist, and a recipient of the 1989 John von Neumann Theory Prize and the 1990 Nobel Memorial Prize in Economic Sciences.
Markowitz is a professor of finance at the Rady School of Management at the University of California, San Diego (UCSD). He is best known for his pioneering work in modern portfolio theory, studying the effects of asset risk, return, correlation and diversification on probable investment portfolio returns.
Biography
Harry Markowitz was born to a Jewish family, the son of Morris and Mildred Markowitz.[1] During high school, Markowitz developed an interest in physics and philosophy, in particular the ideas of David Hume, an interest he continued to follow during his undergraduate years at the University of Chicago. After receiving his B.A., Markowitz decided to continue his studies at the University of Chicago, choosing to specialize in economics. There he had the opportunity to study under important economists, including Milton Friedman, Tjalling Koopmans, Jacob Marschak and Leonard Savage. While still a student, he was invited to become a member of the Cowles Commission for Research in Economics, which was in Chicago at the time.
Markowitz chose to apply mathematics to the analysis of the stock market as the topic for his dissertation. Jacob Marschak, who was the thesis advisor, encouraged him to pursue the topic, noting that it had also been a favorite interest of Alfred Cowles, the founder of the Cowles Commission. While researching the then current understanding of stock prices, which at the time consisted in the present value model of John Burr Williams, Markowitz realized that the theory lacks an analysis of the impact of risk. This insight led to the development of his seminal theory of portfolio allocation under uncertainty, published in 1952 by the Journal of Finance.[2]
In 1952, Harry Markowitz went to work for the RAND Corporation, where he met George Dantzig. With Dantzig's help, Markowitz continued to research optimization techniques, further developing the critical line algorithm for the identification of the optimal mean-variance portfolios, relying on what was later named the Markowitz frontier. In 1955, he received a PhD from the University of Chicago with a thesis on the portfolio theory. The topic was so novel that, while Markowitz was defending his dissertation, Milton Friedman argued his contribution was not economics.[3] During 1955–1956 Markowitz spent a year at the Cowles Foundation,[1] which had moved to Yale University, at the invitation of James Tobin. He published the critical line algorithm in a 1956 paper and used this time at the foundation to write a book on portfolio allocation which was published in 1959.[4]
Markowitz won the Nobel Memorial Prize in Economic Sciences in 1990 while a professor of finance at Baruch College of the City University of New York. In the preceding year, he received the John von Neumann Theory Prize from the Operations Research Society of America (now Institute for Operations Research and the Management Sciences, INFORMS) for his contributions in the theory of three fields: portfolio theory; sparse matrix methods; and simulation language programming (SIMSCRIPT). Sparse matrix methods are now widely used to solve very large systems of simultaneous equations whose coefficients are mostly zero. SIMSCRIPT has been widely used to program computer simulations of manufacturing, transportation, and computer systems as well as war games. SIMSCRIPT (I) included the Buddy memory allocation method, which was also developed by Markowitz.
The company that would become CACI International was founded by Herb Karr and Harry Markowitz on July 17, 1962 as California Analysis Center, Inc. They helped develop SIMSCRIPT, the first simulation programming language, at RAND and after it was released to the public domain, CACI was founded to provide support and training for SIMSCRIPT.
In 1968, Markowitz joined Arbitrage Management company founded by Michael Goodkin. Working with Paul Samuelson and Robert Merton he created a hedge fund that represents the first known attempt at computerized arbitrage trading. He took over as chief executive in 1970. After a successful run as a private hedge fund, AMC was sold to Stuart & Co. in 1971. A year later, Markowitz left the company.[5]
Markowitz now divides his time between teaching (he is an adjunct professor at the Rady School of Management at the University of California at San Diego, UCSD); video casting lectures; and consulting (out of his Harry Markowitz Company offices). He currently serves on the Advisory Board of BPV Capital Management (formerly SkyView Investment Advisors), an alternative investment advisory firm and fund of hedge funds. Markowitz also serves on the Investment Committee of LWI Financial Inc. ("Loring Ward"), a San Jose, California-based investment advisor; on the advisory panel of Robert D. Arnott's Newport Beach, California based investment management firm, Research Affiliates; on the Advisory Board of Mark Hebner's Irvine, California and internet based investment advisory firm, Index Fund Advisors; and as an advisor to the Investment Committee of 1st Global, a Dallas, Texas-based wealth management and investment advisory firm. Markowitz advises and serves on the board of ProbabilityManagement.org, a 501(c)(3) non-profit founded by Dr. Sam L. Savage to reshape the communication and calculation of uncertainty.[6]
Markowitz is co-founder and Chief Architect of GuidedChoice, a 401(k) managed accounts provider and investment advisor. Markowitz’s more recent work has included designing the backbone software analytics for the GuidedChoice investment solution and heading the GuidedChoice Investment Committee. He is actively involved in designing the next step in the retirement process: assisting retirees with wealth distribution through GuidedSpending.
Research
A Markowitz Efficient Portfolio is one where no added diversification can lower the portfolio's risk for a given return expectation (alternately, no additional expected return can be gained without increasing the risk of the portfolio). The Markowitz Efficient Frontier is the set of all portfolios that will give the highest expected return for each given level of risk. These concepts of efficiency were essential to the development of the capital asset pricing model.
Markowitz also co-edited the textbook The Theory and Practice of Investment Management with Frank J. Fabozzi of Yale School of Management.
Harry Markowitz Model
Introduction
Harry Markowitz put forward this model in 1952. It assists in the selection of the most efficient by analyzing various possible portfolios of the given securities. By choosing securities that do not 'move' exactly together, the HM model shows investors how to reduce their risk. The HM model is also called Mean-Variance Model due to the fact that it is based on expected returns (mean) and the standard deviation (variance) of the various portfolios. Harry Markowitz made the following assumptions while developing the HM model:[7][8]
1. Risk of a portfolio is based on the variability of returns from the said portfolio.
2. An investor is risk averse.
3. An investor prefers to increase consumption.
4. The investor's utility function is concave and increasing, due to his risk aversion and consumption preference.[8]
5. Analysis is based on single period model of investment.[8]
6. An investor either maximizes his portfolio return for a given level of risk or maximizes his return for the minimum risk.[9]
7. An investor is rational in nature.[8]
To choose the best portfolio from a number of possible portfolios, each with different return and risk, two separate decisions are to be made:
1. Determination of a set of efficient portfolios.
2. Selection of the best portfolio out of the efficient set.
Determining the Efficient Set
A portfolio that gives maximum return for a given risk, or minimum risk for given return is an efficient portfolio. Thus, portfolios are selected as follows:
(a) From the portfolios that have the same return, the investor will prefer the portfolio with lower risk, and [7]
(b) From the portfolios that have the same risk level, an investor will prefer the portfolio with higher rate of return.
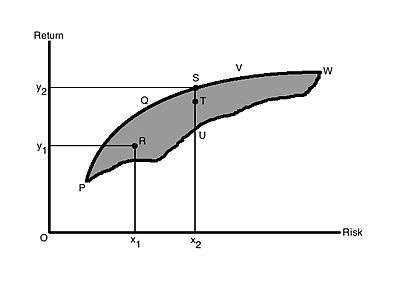
As the investor is rational, they would like to have higher return. And as he is risk averse, he wants to have lower risk.[7] In Figure 1, the shaded area PVWP includes all the possible securities an investor can invest in. The efficient portfolios are the ones that lie on the boundary of PQVW. For example, at risk level x2, there are three portfolios S, T, U. But portfolio S is called the efficient portfolio as it has the highest return, y2, compared to T and U. All the portfolios that lie on the boundary of PQVW are efficient portfolios for a given risk level.
The boundary PQVW is called the Efficient Frontier. All portfolios that lie below the Efficient Frontier are not good enough because the return would be lower for the given risk. Portfolios that lie to the right of the Efficient Frontier would not be good enough, as there is higher risk for a given rate of return. All portfolios lying on the boundary of PQVW are called Efficient Portfolios. The Efficient Frontier is the same for all investors, as all investors want maximum return with the lowest possible risk and they are risk averse.
Choosing the best Portfolio
For selection of the optimal portfolio or the best portfolio, the risk-return preferences are analyzed. An investor who is highly risk averse will hold a portfolio on the lower left hand of the frontier, and an investor who isn’t too risk averse will choose a portfolio on the upper portion of the frontier.
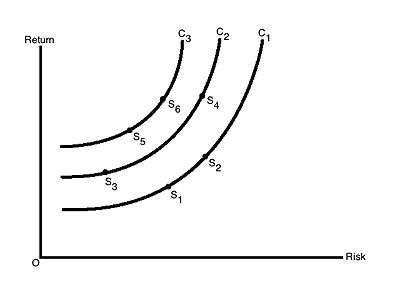
Figure 2 shows the risk-return indifference curve for the investors. Indifference curves C1, C2 and C3 are shown. Each of the different points on a particular indifference curve shows a different combination of risk and return, which provide the same satisfaction to the investors. Each curve to the left represents higher utility or satisfaction. The goal of the investor would be to maximize his satisfaction by moving to a curve that is higher. An investor might have satisfaction represented by C2, but if his satisfaction/utility increases, he/she then moves to curve C3 Thus, at any point of time, an investor will be indifferent between combinations S1 and S2, or S5 and S6.
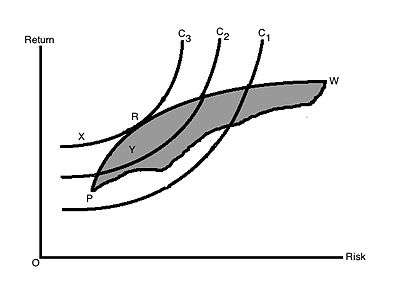
The investor's optimal portfolio is found at the point of tangency of the efficient frontier with the indifference curve. This point marks the highest level of satisfaction the investor can obtain. This is shown in Figure 3. R is the point where the efficient frontier is tangent to indifference curve C3, and is also an efficient portfolio. With this portfolio, the investor will get highest satisfaction as well as best risk-return combination (a portfolio that provides the highest possible return for a given amount of risk). Any other portfolio, say X, isn't the optimal portfolio even though it lies on the same indifference curve as it is outside the feasible portfolio available in the market. Portfolio Y is also not optimal as it does not lie on the best feasible indifference curve, even though it is a feasible market portfolio. Another investor having other sets of indifference curves might have some different portfolio as his best/optimal portfolio.
All portfolios so far have been evaluated in terms of risky securities only, and it is possible to include risk-free securities in a portfolio as well. A portfolio with risk-free securities will enable an investor to achieve a higher level of satisfaction. This has been explained in Figure 4.
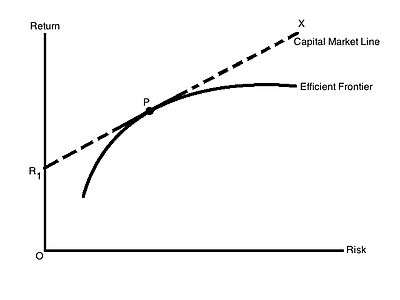
R1 is the risk-free return, or the return from government securities, as government securities have no risk. R1PX is drawn so that it is tangent to the efficient frontier. Any point on the line R1PX shows a combination of different proportions of risk-free securities and efficient portfolios. The satisfaction an investor obtains from portfolios on the line R1PX is more than the satisfaction obtained from the portfolio P. All portfolio combinations to the left of P show combinations of risky and risk-free assets, and all those to the right of P represent purchases of risky assets made with funds borrowed at the risk-free rate.
In the case that an investor has invested all his funds, additional funds can be borrowed at risk-free rate and a portfolio combination that lies on R1PX can be obtained. R1PX is known as the Capital Market Line (CML). this line represents the risk-return trade off in the capital market. The CML is an upward sloping curve, which means that the investor will take higher risk if the return of the portfolio is also higher. The portfolio P is the most efficient portfolio, as it lies on both the CML and Efficient Frontier, and every investor would prefer to attain this portfolio, P. The P portfolio is known as the Market Portfolio and is also the most diversified portfolio. It consists of all shares and other securities in the capital market.
In the market for portfolios that consists of risky and risk-free securities, the CML represents the equilibrium condition. The Capital Market Line says that the return from a portfolio is the risk-free rate plus risk premium. Risk premium is the product of the market price of risk and the quantity of risk, and the risk is the standard deviation of the portfolio.
The CML equation is :
RP = IRF + (RM - IRF)σP/σM
Where,
RP = Expected Return of Portfolio
RM = Return on the Market Portfolio
IRF = Risk-Free rate of interest
σM = Standard Deviation of the market portfolio
σP = Standard Deviation of portfolio
(RM - IRF)/σM is the slope of CML. (RM - IRF) is a measure of the risk premium, or the reward for holding risky portfolio instead of risk-free portfolio. σM is the risk of the market portfolio. Therefore, the slope measures the reward per unit of market risk.
The characteristic features of CML are:
1. At the tangent point, i.e. Portfolio P, is the optimum combination of risky investments and the market portfolio.
2. Only efficient portfolios that consist of risk free investments and the market portfolio P lie on the CML.
3. CML is always upward sloping as the price of risk has to be positive. A rational investor will not invest unless he knows he will be compensated for that risk.
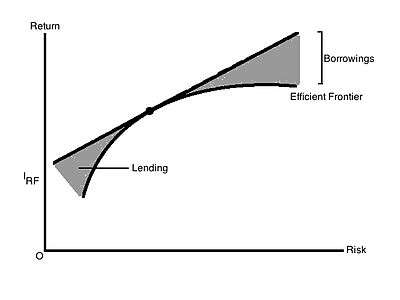
Figure 5 shows that an investor will choose a portfolio on the efficient frontier, in the absence of risk-free investments. But when risk-free investments are introduced, the investor can choose the portfolio on the CML (which represents the combination of risky and risk-free investments). This can be done with borrowing or lending at the risk-free rate of interest (IRF) and the purchase of efficient portfolio P. The portfolio an investor will choose depends on his preference of risk. The portion from IRF to P, is investment in risk-free assets and is called Lending Portfolio. In this portion, the investor will lend a portion at risk-free rate. The portion beyond P is called Borrowing Portfolio, where the investor borrows some funds at risk-free rate to buy more of portfolio P.
Demerits of the HM Model
1. Unless positivity constraints are assigned, the Markowitz solution can easily find highly leveraged portfolios (large long positions in a subset of investable assets financed by large short positions in another subset of assets), but given their leveraged nature the returns from such a portfolio are extremely sensitive to small changes in the returns of the constituent assets and can therefore be extremely 'dangerous'. Positivity constraints are easy to enforce and fix this problem, but if the user wants to 'believe' in the robustness of the Markowitz approach, it would be nice if better-behaved solutions (at the very least, positive weights) were obtained in an unconstrained manner when the set of investment assets is close to the available investment opportunities (the market portfolio) – but this is often not the case.
2. Practically more vexing, small changes in inputs can give rise to large changes in the portfolio. Mean-variance optimization has been dubbed an 'error maximization' device (Scherer 2002): 'an algorithm that takes point estimates (of returns and covariances) as inputs and treats them as if they were known with certainty will react to tiny return differences that are well within measurement error'. In the real world, this degree of instability will lead, to begin with, to large transaction costs, but it is also likely to shake the confidence of the portfolio manager in the model.
3. The amount of information (the covariance matrix, specifically, or a complete joint probability distribution among assets in the market portfolio) needed to compute a mean-variance optimal portfolio is often intractable and certainly has no room for subjective measurements ('views' about the returns of portfolios of subsets of investable assets).
Selected publications
- Markowitz, H.M. (March 1952). "Portfolio Selection". The Journal of Finance. 7 (1): 77–91. doi:10.2307/2975974. JSTOR 2975974.
- Markowitz, H.M. (April 1952). "The Utility of Wealth" (PDF). The Journal of Political Economy (Cowles Foundation Paper 57). LX (2): 151–158. doi:10.1086/257177.
- Markowitz, H.M. (April 1957). "The Elimination Form of the Inverse and Its Application to Linear Programming". Management Science. 3 (3): 255–269. doi:10.1287/mnsc.3.3.255.
- Markowitz, H.M. (1959). Portfolio Selection: Efficient Diversification of Investments. New York: John Wiley & Sons. (reprinted by Yale University Press, 1970, ISBN 978-0-300-01372-6; 2nd ed. Basil Blackwell, 1991, ISBN 978-1-55786-108-5)
- Markowitz, H.M. (October 1, 1979). Belzer, Jack; Holzman, Albert G.; Kent, Allen, eds. "SIMSCRIPT", Encyclopedia of Computer Science and Technology. 13. New York and Basel: Marcel Dekker. p. 516. ISBN 978-0-8247-2263-0.
- Markowitz, H.M. and E. van Dijk (March–April 2003). "Single-Period Mean-Variance Analysis in a Changing World". Financial Analysts Journal. 59 (2): 30–44. doi:10.2469/faj.v59.n2.2512.
- Markowitz, H.M. (September–October 2005). "Market Efficiency: A Theoretical Distinction and So What?" (PDF). Financial Analysts Journal. 61 (5): 17–30. doi:10.2469/faj.v61.n5.2752.
- Markowitz, H.M. (2009). Harry Markowitz: Selected Works. World Scientific-Nobel Laureate Series: Vol. 1. Hackensack, New Jersey: World Scientific. p. 716. ISBN 978-981-283-364-8.
See also
References
- 1 2 Harry M. Markowitz – Autobiography, The Nobel Prizes 1990, Editor Tore Frängsmyr, [Nobel Foundation], Stockholm, 1991
- ↑ Markowitz, H.M. (March 1952). "Portfolio Selection". The Journal of Finance. 7 (1): 77–91. doi:10.2307/2975974. JSTOR 2975974.
- ↑ Harry M. Markowitz – Nobel Prize Lecture: Foundations of Portfolio Theory, December 7, 1990 ( PDF format)
- ↑ Markowitz, H.M. (1959). Portfolio Selection: Efficient Diversification of Investments. New York: John Wiley & Sons. (reprinted by Yale University Press, 1970, ISBN 978-0-300-01372-6; 2nd ed. Basil Blackwell, 1991, ISBN 978-1-55786-108-5)
- ↑ Goodkin, Michael. The Wrong Answer Faster: The Inside Story of Making the Machine that Trades Trillions. John Wiley & Sons, 2012
- ↑ http://www.ProbabilityManagement.org
- 1 2 3 Rustagi, R.P. Financial Management. India: Taxmann Publications (P.) Ltd. ISBN 978-81-7194-786-7.
- 1 2 3 4 "Markowitz Model" (PDF).
- ↑ "Markowitz".
External links
| Wikiquote has quotations related to: Harry Markowitz |
- Harry Markowitz: Videos of Interviews by Mark Hebner and Weston Wellington and Presentations by Professor Markowitz
- The Sveriges Riksbank Prize in Economic Sciences in Memory of Alfred Nobel, 1990
- Autobiography, The Nobel Prizes 1990, Editor Tore Frängsmyr, [Nobel Foundation], Stockholm, 1991
- Banquet Speech, December 10, 1990
- Nobel Prize Lecture: Foundations of Portfolio Theory, December 7, 1990 ( PDF format)
- Oral history interview with Harry M. Markowitz, Charles Babbage Institute, University of Minnesota – Markowitz discusses his development of portfolio theory, sparse matrices, and his work at the RAND Corporation and elsewhere on simulation software development (including computer language SIMSCRIPT), modeling, and operations research.
- History of Finance, interviews, The American Finance Association
- Adjunct Professor of Finance, bio, Rady School of Management, University of California at San Diego
- 1st Global Engages Dr. Harry M. Markowitz, 1st Global
- Harry Markowitz (1927– ). The Concise Encyclopedia of Economics. Library of Economics and Liberty (2nd ed.). Liberty Fund. 2008.
- http://people.maths.ox.ac.uk/~zhouxy/download/mvjump_part2.pdf
- http://home.dacor.net/norton/finance-math/problems_w_Markowitz.pdf
- Biography of Harry Markowitz from the Institute for Operations Research and the Management Sciences
