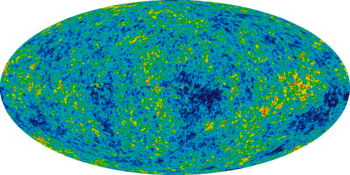
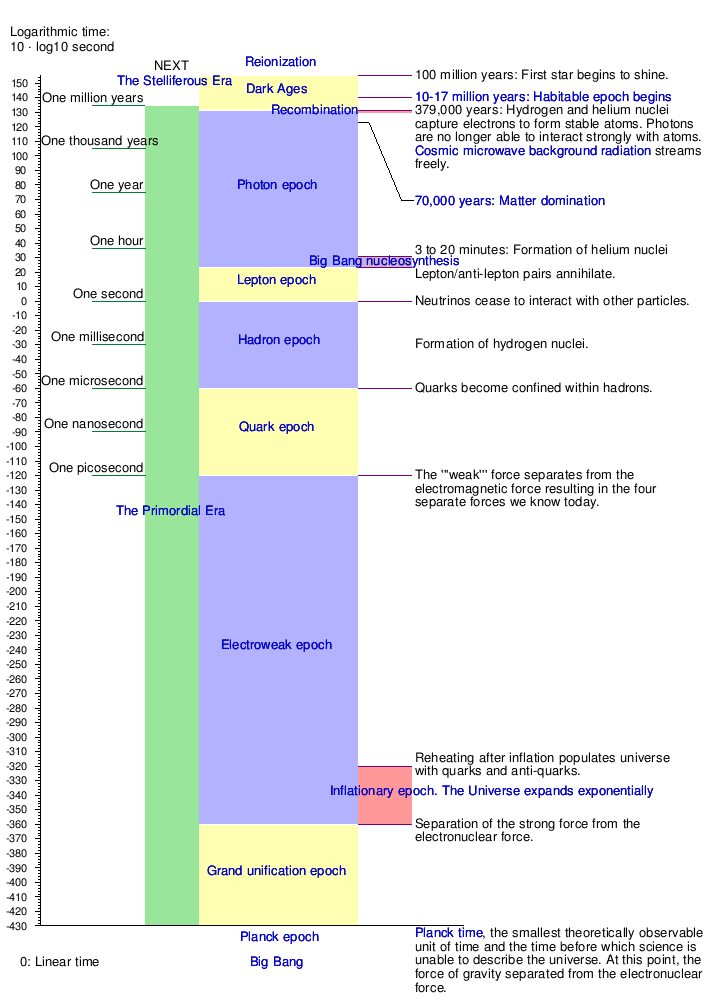
Graphical timeline of the Big Bang
Main article: Chronology of the universe
| Part of a series on | |||
| Physical cosmology | |||
|---|---|---|---|
 | |||
|
Early universe
|
|||
|
Components · Structure |
|||
| |||
view • discuss •
-13 —
–
-12 —
–
-11 —
–
-10 —
–
-9 —
–
-8 —
–
-7 —
–
-6 —
–
-5 —
–
-4 —
–
-3 —
–
-2 —
–
-1 —
–
0 —
This timeline of the Big Bang shows a sequence of events as currently theorized by scientists, but not yet completely proven. Dark Ages.
It is a logarithmic scale that shows second instead of second. For example, one microsecond is . To convert -30 read on the scale to second calculate second = one millisecond. On a logarithmic time scale a step lasts ten times longer than the previous step.

See also
- Cosmic Calendar (age of the universe scaled to a single year)
- Graphical timeline from Big Bang to Heat Death
- Graphical timeline of the Stelliferous Era
- Graphical timeline of the universe
This article is issued from Wikipedia - version of the 6/3/2016. The text is available under the Creative Commons Attribution/Share Alike but additional terms may apply for the media files.