Fragile States Index
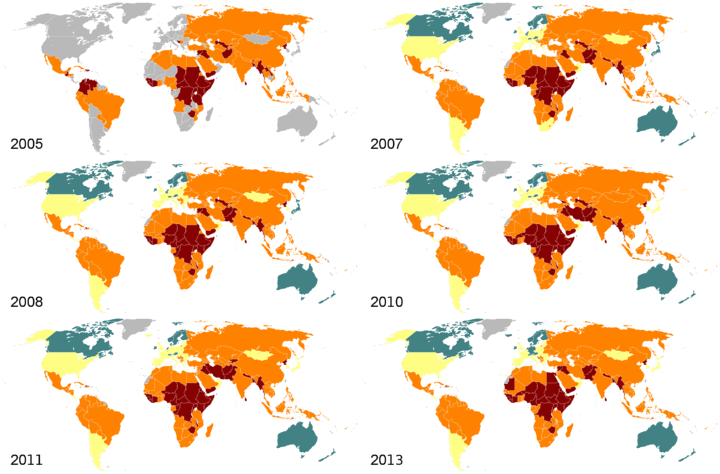
The Fragile States Index (FSI; formerly the Failed States Index) is an annual report published by the United States think tank the Fund for Peace and the magazine Foreign Policy since 2005. The list aims to assess states' vulnerability to conflict or collapse, ranking all sovereign states with membership in the United Nations where there is enough data available for analysis.[1] Taiwan, the Palestinian Territories, Northern Cyprus, Kosovo and Western Sahara are not ranked, despite being recognized as sovereign by one or more other nations. Ranking is based on the sum of scores for 12 indicators (see below). Each indicator is scored on a scale of 0 to 10, with 0 being the lowest intensity (most stable) and 10 being the highest intensity (least stable), creating a scale spanning 0−120.[1]
Methodology
The index's ranks are based on twelve indicators of state vulnerability, grouped by category: social (4), economic (2), and political (6).[2]
Scores are obtained via a process involving content analysis, quantitative data, and qualitative review. In the content analysis phase, millions of documents from over 100,000 English-language or translated sources (social media are excluded)[3] are scanned and filtered through the Fund for Peace's Conflict Assessment Systems Tool (CAST), which utilizes specific filters and search parameters to sort data based on boolean phrases linked to indicators, and assigns scores based on algorithms.[4] Following CAST analysis, quantitative data from sources such as the UN, WHO, World Factbook, Transparency International, World Bank, and Freedom House are incorporated, which then leads to the final phase of qualitative review of each indicator for each country.[3]
Considered together in the Index, the indicators are a way of assessing a state's vulnerability to collapse or conflict, ranking states on a spectrum of categories labeled 'sustainable,' 'stable,' 'warning,' and 'alert.' Within each bracket, scores are also subdivided by severity. The score breakdown[5] is as follows:
| Category | FSI score* | Brackets (2016) | 2015-2016 color | 2005–2014 color |
|---|---|---|---|---|
| Alert | 90.0–120.0 | Very high: 110+
High: 100–109.9 Alert: 90–99.9 |
Red | Red |
| Warning | 60.0–89.9 | High: 80–89.9
Warning: 70–79.9 Low: 60–69.9 |
Yellow-Orange | Orange |
| Stable | 30.0–59.9 | Less stable: 50–59.9
Stable: 40–49.9 More stable: 30–39.9 |
Green | Yellow |
| Sustainable | 0.0–29.9 | Sustainable: 20–29.9
Very sustainable: 0–19.9 |
Blue | Green |
| Not assessed | N/A | — | Light Gray | Light Gray |
All countries in the top three categories display features that make their societies and institutions vulnerable to failure. However, the FSI is not intended as a tool to predict when states may experience violence or collapse, as it does not measure direction or pace of change. It is possible for a state sorted into the 'stable' zone to be deteriorating at a faster rate than those in the more fragile 'warning' or 'alert' zones, and could experience violence sooner. Conversely, states in the Pink zone, though fragile, may exhibit positive signs of recovery or be deteriorating slowly, giving them time to adopt mitigating strategies.[6]
Indicators
The FSI scores, detailed above, are sums of scores for 12 separate indicators related to various aspects of state stability and strength. Each is scored between 0 and 10, with a higher number indicating a higher level of fragility. Indicators are divided into three categories - social, economic, and political.[7]
Social indicators
- Demographic pressures: Pressures deriving from high volume population density relative to food supply and other life-sustaining resources, which make it difficult for governments to protect citizens. Pressures include those stemming from disease, natural disasters, population growth, infant mortality, and environmental hazards. Governmental capacity and will to respond to such pressures are considered in the score.
- Refugees and Internally Displaced Persons (IDPs): Pressures linked to population displacement, which can strain public resources and threaten security. This indicator concerns displacement in both directions: those leaving and those entering a state. Measures include the presence of refugee/IDP camps, refugees/IDPs per capita, absorption capacity, relief efforts, and targeted violence/repression.
- Group Grievance: Existence of tension and/or violence between groups, which can undermine the state's provision of security. Pressures related to discrimination, ethnic violence, communal violence, sectarian violence, and religious violence are included alongside atrocities committed with impunity against groups singled out by state authorities or dominant groups for persecution or repression, and institutionalized political exclusion.[8]
- Human flight and brain drain: Measures related to migration per capita, particularly emigration of the educated population, which often occurs pre- or mid-conflict. Remittances and growth of exile/expatriate communities are also used as measurements.[8]
Economic indicators
- Uneven economic development: Group-based inequality, or perceived inequality, in education, jobs, and economic status can create uneven commitments to the social contract within a state. Measurements include group-based poverty and education levels, existence of slums, and fairness of housing and hiring practices.
- Poverty and economic decline: Progressive economic decline of the society as a whole (measurements: per capita income, GNP, economic deficit, unemployment, poverty levels, business failures, and inflation) strains a state's ability to provide for its citizens, and can create inter-group friction. Also includes failure of the state to pay salaries of government employees and armed forces, or to meet other financial obligations to its citizens, such as pension payments.[8]
Political indicators
- State legitimacy: Corruption and lack of representativeness undermine the social contract, as citizens lose confidence in state institutions and processes. Measurements include corruption or profiteering by ruling elites, resistance to transparency, level of democracy, illicit economy, and protests/demonstrations.
- Public services: Disappearance, or lack of, basic state functions indicate a state's inability to perform one of its key roles. Measurements include essential services, such as healthcare, education, sanitation, public transportation, police, and infrastructure. Also examined is the use of the state apparatus for agencies that serve ruling elites, such as security forces, executive staff, central bank, diplomatic service, customs and collection agencies.
- Human rights and rule of law: The violation or uneven protection of basic rights mark a failure of a state to execute its primary responsibility. Measurements include press freedom and civil liberties, as well as any widespread abuse of legal, political and social rights for individuals, groups, or cultural institutions (e.g., harassment of the press, politicization of the judiciary, internal use of military for political ends, public repression of political opponents, religious or cultural persecution).[8]
- Security apparatus: An emergence of elite or praetorian guards that operate with impunity challenges the security apparatus' monopoly on the use of force, weakening the social contract. Measurements include internal conflict, riots/protests, military coups, rebel activity, and the emergence of state-sponsored or state-supported private militias that terrorize political opponents or civilians seen to be sympathetic to the opposition.
- Factionalised elites: A fragmentation of ruling elites and state institutions along group lines undermines public confidence. Measurements include elite power struggles, flawed elections, and use of aggressive nationalistic rhetoric.
- External Intervention: Intervention by external actors into a state's affairs signals a state's failure to meet domestic or international obligations. Measurements include level of foreign assistance, presence of peacekeepers or UN missions, foreign military intervention, sanctions, and credit ratings. Intervention by donors, especially if there is a tendency towards over-dependence on foreign aid or peacekeeping missions, is also considered.[8]
Fragile states list
For the entire FSI ranking, see List of countries by Fragile States Index.
2016
The top 20 states on the 2016 Fragile States Index is shown below. Change in rank from the previous year is in parentheses.[9]
-
 Somalia (+1)
 -
 South Sudan (-1)
 -
 Central African Republic (0)
 -
 Sudan (0)
 -
 Yemen (+3)
 -
 Syria (+3)
 -
 Chad (-1)
 -
 Democratic Republic of the Congo (-3)
 -
 Afghanistan (0)
 -
 Haiti (+1)
 -
 Iraq (+1)
 -
 Guinea (-2)
 -
 Nigeria (+1)
 -
 Pakistan (+2)
 -
 Burundi (+3)
 -
 Zimbabwe (0)
 -
 Guinea-Bissau (0)
 -
 Eritrea (+6)
 -
 Niger (0)
2015
The top 20 states on the 2015 Fragile States Index is shown below. Change in rank from the previous year is in parentheses.[10]

-
 South Sudan (0)
 -
 Somalia (0)
 -
 Central African Republic (0)
 -
 Sudan (+1)
 -
 Democratic Republic of the Congo (-1)
 -
 Chad (0)
 -
 Yemen (+1)
 -
 Syria (+6)
 -
 Afghanistan (-1)
 -
 Guinea (+2)
 -
 Haiti (-2)
 -
 Iraq (+1)
 -
 Zimbabwe (-3)
 -
 Nigeria (+3)
 -
 Ivory Coast (-1)
 -
 Pakistan (-5)
 -
 Guinea-Bissau (-1)
 -
 Burundi (+3)
 -
 Niger (0)
 -
 Ethiopia (-1)
2014
The top 20 states on the 2014 Fragile States Index is shown below. Change in rank from the previous year is in parentheses.[12]
-
 South Sudan (+3)
 -
 Somalia (-1)
 -
 Central African Republic (+6)
 -
 Democratic Republic of the Congo (-2)
 -
 Sudan (0)
 -
 Chad (-1)
 -
 Yemen (+1)
 -
 Afghanistan (-1)
 -
 Haiti (0)
 -
 Pakistan (+3)
 -
 Zimbabwe (-1)
 -
 Guinea (+2)
 -
 Iraq (0)
 -
 Ivory Coast (-2)
 -
 Syria (Newly ranked)
 -
 Guinea-Bissau (-1)
 -
 Nigeria (0)
 -
 Ethiopia (+1)
 -
 Niger (-1)
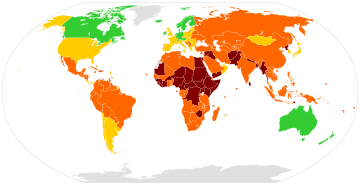
2013
The top 20 states on the 2013 Failed States Index is shown below. Change in rank from the previous year is in parentheses.[13]
-
 Somalia (0)
 -
 Democratic Republic of the Congo (0)
 -
 Sudan (0)
 -
 South Sudan (Newly ranked)
 -
 Chad (-1)
 -
 Yemen (+2)
 -
 Afghanistan (-1)
 -
 Haiti (-1)
 -
 Central African Republic (+1)
 -
 Zimbabwe (-5)
 -
 Iraq (-2)
 -
 Ivory Coast (-1)
 -
 Pakistan (0)
 -
 Guinea (-2)
 -
 Guinea-Bissau (0)
 -
 Nigeria (-2)
 -
 Niger (+1)
 -
 Ethiopia (-2)
 -
 Burundi (-2)
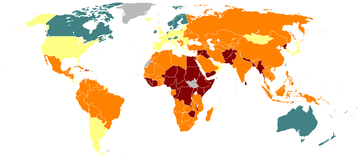
2012
177 states were included in the list, of which 33 were classified as "alert", 92 as "warning", 39 as "moderate", 13 as "sustainable". The worst 20 states are shown below. Change in rank from 2011 is shown in parentheses.[15]
-
 Somalia (0)
 -
 Democratic Republic of the Congo (+2)
 -
 Sudan (0)
 -
 Chad (-2)
 -
 Zimbabwe (+1)
 -
 Afghanistan (+1)
 -
 Haiti (-2)
 -
 Yemen (+5)
 -
 Iraq (0)
 -
 Central African Republic (-2)
 -
 Ivory Coast (-1)
 -
 Guinea (-1)
 -
 Pakistan (-1)
 -
 Nigeria (0)
 -
 Guinea-Bissau (+3)
 -
 Ethiopia (+3)
 -
 Burundi (-1)
 -
 Niger (-4)
 -
 Uganda (+1)
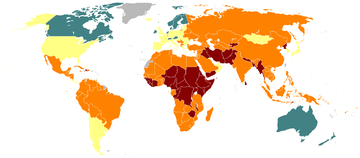
2011
177 states were included in the list, of which 35 were classified as "alert", 88 as "warning", 40 as "moderate", 11 as "sustainable". The worst 20 states are shown below. Change in rank from 2010 is shown in parentheses. There was a tie between Myanmar and Guinea Bissau for 18th.[16]
-
 Somalia (0)
 -
 Chad (0)
 -
 Sudan (0)
 -
 Democratic Republic of the Congo (+1)
 -
 Haiti (+6)
 -
 Zimbabwe (-2)
 -
 Afghanistan (-1)
 -
 Central African Republic (0)
 -
 Iraq (-2)
 -
 Ivory Coast (+2)
 -
 Guinea (-2)
 -
 Pakistan (-2)
 -
 Yemen (+2)
 -
 Nigeria (0)
 -
 Niger (+5)
 -
 Burundi (+6)
 - -
 Guinea-Bissau (+4)
 - -
 Myanmar (-2)
 -
 Ethiopia (-3)
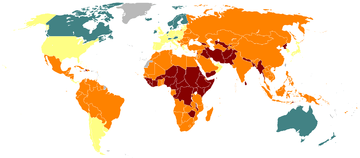
2010
177 states were included in the list, of which 37 were classified as "alert", 92 as "warning", 35 as "moderate", 13 as "sustainable". The lowest 20 states are shown below. Change in rank from 2009 is shown in parentheses. There was a tie for 19th place between North Korea and Niger.[17]
-
 Somalia (0)
 -
 Chad (+2)
 -
 Sudan (0)
 -
 Zimbabwe (-2)
 -
 Democratic Republic of the Congo (0)
 -
 Afghanistan (+1)
 -
 Iraq (-1)
 -
 Central African Republic (0)
 -
 Guinea (0)
 -
 Pakistan (0)
 -
 Haiti (+1)
 -
 Ivory Coast (-1)
 -
 Nigeria (+1)
 -
 Yemen (+4)
 -
.svg.png) Burma (-3)
Burma (-3) -
 Ethiopia (-1)
 -
 East Timor (+2)
 - -
 North Korea (-2)
 - -
 Niger (+4)
2009
177 states were included in the list, of which 38 were classified as "alert", 93 as "warning", 33 as "moderate", 13 as "sustainable". The worst 20 states are shown below. Change in rank from 2008 is shown in parentheses.[18]
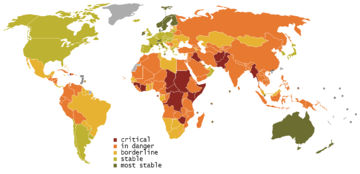
-
 Somalia (0)
 -
 Zimbabwe (+1)
 -
 Sudan (-1)
 -
 Chad (0)
 -
 Democratic Republic of the Congo (+1)
 -
 Iraq (-1)
 -
 Afghanistan (0)
 -
 Central African Republic (+2)
 -
 Guinea (+2)
 -
 Pakistan (-1)
 -
 Ivory Coast (-3)
 -
 Haiti (+2)
 -
.svg.png) Burma (0)
Burma (0) -
 Nigeria (+3)
 -
 Ethiopia (0)
 -
 North Korea (-2)
 -
 Yemen (+3)
 -
 Bangladesh (-7)
 -
 East Timor (+5)
2008
177 states were included in the list, of which 35 were classified as "alert", 92 as "warning", 35 as "moderate", 15 as "sustainable". The worst 20 states are shown below. Change in rank from 2007 is shown in parentheses.[19]
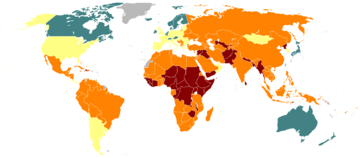
-
 Somalia (+2)
 -
 Sudan (-1)
 -
 Zimbabwe (+1)
 -
 Chad (+1)
 -
.svg.png) Iraq (-3)
Iraq (-3) -
 Democratic Republic of the Congo (+1)
 -
 Afghanistan (+1)
 -
 Ivory Coast (-2)
 -
 Pakistan (+3)
 -
 Central African Republic (0)
 -
 Guinea (-2)
 -
 Bangladesh (+4)
 -
.svg.png) Burma (+2)
Burma (+2) -
 Haiti (-3)
 -
 North Korea (-2)
 -
 Ethiopia (+2)
 -
 Uganda (-1)
 -
 Lebanon (+10)[20]
 -
 Nigeria (-1)
 -
 Sri Lanka (+5)[21]
2007
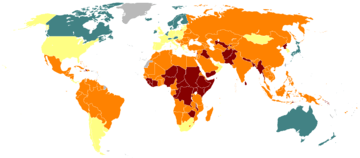
177 states were included in the list, of which 32 were classified as "alert", 97 as "warning", 33 as "moderate", 15 as "sustainable". The worst 20 states are shown below. Change in rank from 2006 is shown in parentheses.[22]
-
 Sudan (0)
 -
.svg.png) Iraq (+2)
Iraq (+2) -
 Somalia (+4)
 -
 Zimbabwe (+1)
 -
 Chad (+1)
 -
 Ivory Coast (-3)
 -
 Democratic Republic of the Congo (-5)
 -
 Afghanistan (+2)
 -
 Guinea (+2)
 -
 Central African Republic (+3)
 -
 Haiti (-3)
 -
 Pakistan (-3)
 -
 North Korea (+1)
 -
 Burma (+4)
 -
 Uganda (+6)[23]
 -
 Bangladesh (+3)
 -
 Nigeria (+5)[24]
 -
 Ethiopia (+8)[25]
 -
 Burundi (-4)
 -
 Timor-Leste (N/A)[26]
2006
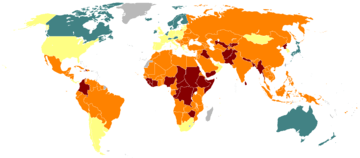
146 states were included in the 2006 list, of which 28 were classified as "alert", 78 as "warning", 27 as "moderate", 13 as "sustainable". The worst 20 states are shown below. Change in rank from 2005 is shown in parentheses.[27]
-
 Sudan (+2)
 -
 Democratic Republic of the Congo (0)
 -
 Ivory Coast (-2)
 -
.svg.png) Iraq (0)
Iraq (0) -
 Zimbabwe (+10)
 -
 Chad (+1)
 -
 Somalia (-2)
 -
 Haiti (+2)
 -
 Pakistan (+25)[28]
 -
 Afghanistan (+1)
 -
 Guinea (+5)
 -
 Liberia (-3)
 -
 Central African Republic (+7)
 -
 North Korea (-1)
 -
 Burundi (+3)
 -
 Yemen (-8)
 -
 Sierra Leone (-11)
 -
.svg.png) Burma (+5)[29]
Burma (+5)[29] -
 Bangladesh (-2)
 -
 Nepal (+15)[30]
2005
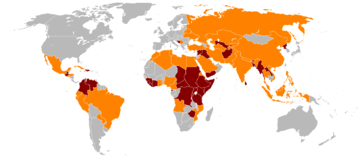
2005 was the first year that the Fund for Peace published the list. 76 states were analyzed, of which 33 were classified as "alert" and 43 as "warning" (ratings better than "warning" were not done in this year). The worst 20 are shown below.[31]
-
 Ivory Coast
 -
.svg.png) Democratic Republic of the Congo
Democratic Republic of the Congo -
 Sudan
Sudan -
.svg.png) Iraq
Iraq -
 Somalia
 -
 Sierra Leone
 -
 Chad
Chad -
 Yemen
Yemen -
 Liberia
 -
 Haiti
Haiti -
 Afghanistan
 -
 Rwanda
 -
 North Korea
 -
 Colombia
 -
 Zimbabwe
 -
 Guinea
 -
 Bangladesh
 -
 Burundi
 -
 Dominican Republic
 -
 Central African Republic
Criticism
Years of controversy over the 'failed state' terminology in the Index's name contributed to change in 2014, with a shift from the Failed States Index to the Fragile States Index. Critics had argued that the term established a false 'binary' division, or false dichotomy, between states that were salvageable and those that were beyond recovery.[32][33] Krista Hendry, FFP's Executive Director, explained the change in part as a reaction to the debate 'failed state' had generated, noting that "the name was negatively impacting our ability to get the right kind of attention for the FSI."[34]
Several academics and journalists have also criticized the FSI for a lack of utility and/or its measurement criteria. Authors writing for The National Interest and The Washington Post have argued that the FSI sends a message that the solution to problems in the developing world is "more state-building,"[35][36] when in fact state-building could be viewed as a cause of instability or fragility. Claire Leigh, writing for The Guardian in 2012, blasted the index as a "useless policy tool" which focused only on the symptoms of struggling states, ignoring causes or potential cures.[32]
Critics have also identified flaws with the FSI's measurement criteria, as well as the (lack of) transparency surrounding its base data analysis.[35][37] For example, indicators related to refugees and human flight (see #2 and #4, above) have allowed North Korea's score to improve as human flight has declined;[38] while this may indicate a stronger security apparatus in the state, should it be celebrated as improvement?[37] Additionally, analysis of the indicators has led several commentators to conclude that a combination of too many categories and a failure to distinguish between 'government' and 'state' (sometimes allowing political moves, such as Iran agreeing to negotiations with the West, to positively impact a score) complicates efforts to utilize findings.[35][39][40] Several have argued for greater transparency in scoring methods,[32][35] a reworking of the criteria to give the index predictive value,[35] and a consolidation of indicators into umbrella groups for easier comparison.[40]
Related indices
The Organization for Economic Cooperation and Development (OECD) has based its annual Fragile States Report, now named ‘States of Fragility,’[41] on the FSI, as well as on data from the World Bank (which publishes its own lists of fragile states[42]), since 2005.[43]
On a monthly basis, International Crisis Group (ICG), a transnational non-governmental organization (NGO), publishes CrisisWatch, a bulletin designed to inform readers about the development of state-based conflict across the globe. The reports indicate whether or not situations have improved, deteriorated, or remained unchanged from the previous month, and seek to highlight where there may be risks of new/escalated (or opportunities for resolution of) conflicts in the coming month.[44]
In 2008, Brookings, a U.S.-based think tank, also published an Index of State Weakness in the Developing World, examining 141 countries according to performance in four spheres: economic, political, security and social welfare. The report was written by Stewart Patrick and then-Brookings Senior Fellow Susan Rice.
See also
References
- 1 2 "Failed States FAQ". the Fund for Peace. Retrieved 2007-08-25.
- ↑ "Failed States list 2007". Foreign Policy magazine. Retrieved 2007-06-19.
- 1 2 "What Methodology Was Used for the Ratings? | The Fund for Peace". fsi.fundforpeace.org. Retrieved 2016-01-20.
- ↑ "Methodology | The Fund for Peace". fsi.fundforpeace.org. Retrieved 2016-01-20.
- ↑ "What do the Colors and Categories in the Index and on the Map Signify? | The Fund for Peace". fsi.fundforpeace.org. Retrieved 2016-01-21.
- ↑ "What do the Colors and Categories in the Index and on the Map Signify? | The Fund for Peace". fsi.fundforpeace.org. Retrieved 2016-01-20.
- ↑ "Indicators | The Fund for Peace". fsi.fundforpeace.org. Retrieved 2016-01-20.
- 1 2 3 4 5 "CAST Conflict Assessment Framework Manual | The Fund for Peace". library.fundforpeace.org. Retrieved 2016-01-20.
- ↑ "Fragile States Index 2016". Fund for Peace. Retrieved 2015-08-05.
- ↑ "Fragile States Index 2015". Fund for Peace. Retrieved 2015-07-06.
- ↑ "The Fragile States Index 2015 - The Fund for Peace". Fund for Peace. Retrieved 2016-02-15.
- ↑ "Fragile States Index 2014". Fund for Peace. Retrieved 2014-11-24.
- ↑ "Failed States Index 2013". Fund for Peace. Retrieved 2013-08-23.
- ↑ http://ffp.statesindex.org/rankings-2013-sortable The Failed States Index 2013, Foreign Policy, accessed 19 AUG 2013
- ↑ "Failed States Index 2012". Fund for Peace. Retrieved 2013-04-08.
- ↑ "Failed States Index 2011". Fund for Peace. Retrieved 2013-04-08.
- ↑ "Failed States Index 2010". Fund for Peace. Retrieved 2013-04-08.
- ↑ "Failed States Index 2009". Fund for Peace. Retrieved 2013-04-08.
- ↑ "Failed States Index 2008". Fund for Peace. Retrieved 2013-04-08.
- ↑ Lebanon was ranked 28th in 2007.
- ↑ Sri Lanka was ranked 25th in 2007.
- ↑ "Failed States Index 2007". Fund for Peace. Retrieved 2013-04-08.
- ↑ Uganda was ranked 21st in 2006.
- ↑ Nigeria was ranked 22nd in 2006.
- ↑ Ethiopia was ranked 26th in 2006.
- ↑ 2007 was the first year in which Timor-Leste (East Timor) was included.
- ↑ "Failed States Index 2006". Fund for Peace. Retrieved 2013-04-08.
- ↑ Pakistan was ranked 34th in 2005.
- ↑ Burma/Myanmar was ranked 23rd in 2005.
- ↑ Nepal was ranked 35th in 2005.
- ↑ "Failed States Index 2005". Fund for Peace. Retrieved 2013-04-08.
- 1 2 3 Leigh, Claire (2012-07-02). "Failed States Index belongs in the policy dustbin". The Guardian. ISSN 0261-3077. Retrieved 2016-01-20.
- ↑ "The Failure of the Failed States Index | World Policy Institute". www.worldpolicy.org. Retrieved 2016-01-20.
- ↑ "From Failed to Fragile: Renaming the Index". library.fundforpeace.org. Retrieved 2016-01-20.
- 1 2 3 4 5 Beehner, Lionel; Young, Joseph (2014-07-14). "Is ranking failed or fragile states a futile business?". The Washington Post. ISSN 0190-8286. Retrieved 2016-01-20.
- ↑ Evers, Miles M. "The Fatally Flawed Fragile States Index". The National Interest. Retrieved 2016-01-20.
- 1 2 "Fragile is the New Failure". Political Violence @ a Glance. Retrieved 2016-01-20.
- ↑ "North Korea | The Fund for Peace". fsi.fundforpeace.org. Retrieved 2016-01-20.
- ↑ "Why the Failed State Index is a fail". www.africareview.com. Retrieved 2016-01-20.
- 1 2 "2009 Failed States Index – Disorder in the Ranks". Foreign Policy. Retrieved 2016-01-20.
- ↑ "States of Fragility 2015 - Meeting Post-2015 Ambitions - en - OECD". www.oecd.org. Retrieved 2016-01-20.
- ↑ "Fragility, Conflict and Violence". www.worldbank.org. Retrieved 2016-01-20.
- ↑ "States of Fragility Report - OECD". www.oecd.org. Retrieved 2016-01-20.
- ↑ "CrisisWatch - International Crisis Group". www.crisisgroup.org. Retrieved 2016-01-20.