Energy in Belarus

Location
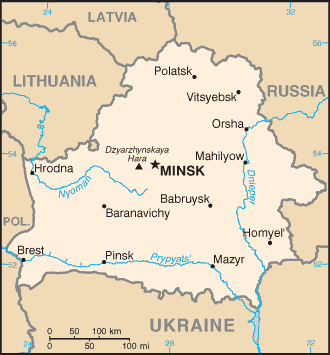
Energy in Belarus describes energy and electricity production, consumption and import in Belarus. Belarus is a net energy importer. According to IEA, the energy import exceeded the energy use in 2008. Primary energy use in Belarus was 327 TWh or 34 TWh per million persons in 2008.[1]
Primary energy use per capita in Belarus in 2009 (34 MWh) was slightly more than in Portugal (26 MWh) and about half of the use in Belgium (64 MWh) or Sweden (62 MWh).[1]
Overview
| Energy in Belarus[2] | ||||||
|---|---|---|---|---|---|---|
| Capita | Prim. energy | Production | Import | Electricity | CO2-emission | |
| Million | TWh | TWh | TWh | TWh | Mt | |
| 2004 | 9.82 | 311 | 42 | 272 | 30.9 | 60.6 |
| 2007 | 9.70 | 326 | 47 | 276 | 32.5 | 62.7 |
| 2008 | 9.68 | 327 | 47 | 287 | 33.2 | 64.2 |
| 2009 | 9.66 | 311 | 47 | 258 | 31.4 | 60.8 |
| 2012 | 9.47 | 343 | 50 | 286 | 34.4 | 66.0 |
| 2012R | 9.46 | 355 | 47.9 | 309 | 35.0 | 71.1 |
| 2013 | 9.47 | 317 | 46.4 | 274 | 34.5 | 58.3 |
| Change 2004-09 | -1.6 % | -0.1 % | 11.9 % | -5.0 % | 1.6 % | 0.2 % |
| Mtoe = 11.63 TWh, Prim. energy includes energy losses [3]
2012R = CO2 calculation criteria changed, numbers updated | ||||||
¨
See also
| Wikimedia Commons has media related to Energy in Belarus. |
References
- 1 2 IEA Key energy statistics 2010 Page: Country specific indicator numbers from page 48
- ↑ IEA Key World Energy Statistics Statistics 2015, 2014 (2012R as in November 2015 + 2012 as in March 2014 is comparable to previous years statistical calculation criteria, 2013, 2012, 2011, 2010, 2009, 2006 IEA October, crude oil p.11, coal p. 13 gas p. 15
- ↑ Energy in Sweden 2010. Facts and figures. The Swedish Energy Agency. Table 8 Losses in nuclear power stations Table 9 Nuclear power brutto
This article is issued from Wikipedia - version of the 12/11/2015. The text is available under the Creative Commons Attribution/Share Alike but additional terms may apply for the media files.

.svg.png)
.svg.png)